

Levels of plasma circulating cell free nuclear and mitochondrial DNA as potential biomarkers for breast tumors
- PMID: 19922604
- PMCID: PMC2780981
- DOI: 10.1186/1476-4598-8-105
Levels of plasma circulating cell free nuclear and mitochondrial DNA as potential biomarkers for breast tumors
Abstract
Background: With the aim to simplify cancer management, cancer research lately dedicated itself more and more to discover and develop non-invasive biomarkers. In this connection, circulating cell-free DNA (ccf DNA) seems to be a promising candidate. Altered levels of ccf nuclear DNA (nDNA) and mitochondrial DNA (mtDNA) have been found in several cancer types and might have a diagnostic value.
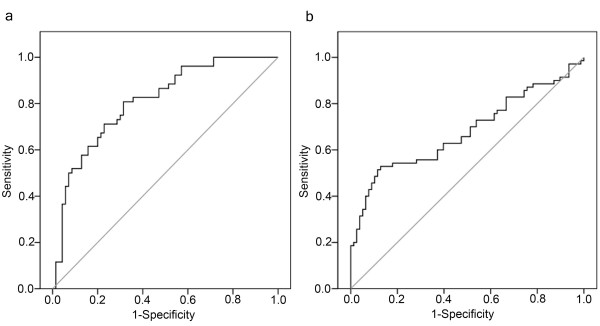
Methods: Using multiplex real-time PCR we investigated the levels of ccf nDNA and mtDNA in plasma samples from patients with malignant and benign breast tumors, and from healthy controls. To evaluate the applicability of plasma ccf nDNA and mtDNA as a biomarker for distinguishing between the three study-groups we performed ROC (Receiver Operating Characteristic) curve analysis. We also compared the levels of both species in the cancer group with clinicopathological parameters.
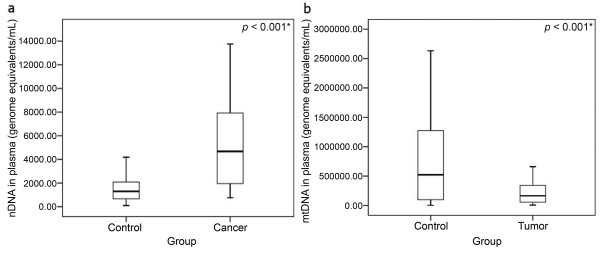
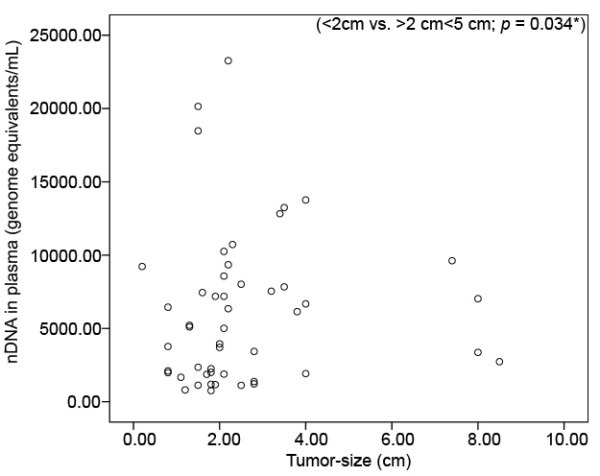
Results: While the levels of ccf nDNA in the cancer group were significantly higher in comparison with the benign tumor group (P < 0.001) and the healthy control group (P < 0.001), the level of ccf mtDNA was found to be significantly lower in the two tumor-groups (benign: P < 0.001; malignant: P = 0.022). The level of ccf nDNA was also associated with tumor-size (<2 cm vs. >2 cm<5 cm; 2250 vs. 6658; Mann-Whitney-U-Test: P = 0.034). Using ROC curve analysis, we were able to distinguish between the breast cancer cases and the healthy controls using ccf nDNA as marker (cut-off: 1866 GE/ml; sensitivity: 81%; specificity: 69%; P < 0.001) and between the tumor group and the healthy controls using ccf mtDNA as marker (cut-off: 463282 GE/ml; sensitivity: 53%; specificity: 87%; P < 0.001).
Conclusion: Our data suggests that nuclear and mitochondrial ccf DNA have potential as biomarkers in breast tumor management. However, ccf nDNA shows greater promise regarding sensitivity and specificity.
Figures
References
-
- Chou YY, Lepore N, Avedissian C, Madsen SK, Parikshak N, Hua X. Mapping correlations between ventricular expansion and CSF amyloid and tau biomarkers in 240 subjects with Alzheimer's disease, mild cognitive impairment and elderly controls. Neuroimage. 2009;46(2):394–410. doi: 10.1016/j.neuroimage.2009.02.015. - DOI - PMC - PubMed
-
- Nicolini A, Tartarelli G, Carpi A, Metelli MR, Ferrari P, Anselmi L. Intensive post-operative follow-up of breast cancer patients with tumor markers: CEA, TPA or CA15.3 vs MCA and MCA-CA15.3 vs CEA-TPA-CA15.3 panel in the early detection of distant metastases. BMC Cancer. 2006;6:269. doi: 10.1186/1471-2407-6-269. - DOI - PMC - PubMed
Publication types
MeSH terms
Substances
LinkOut - more resources
Full Text Sources
Other Literature Sources
Medical
Research Materials
Miscellaneous
