

In vivo characterization of pancreatic and lymph node tissue by using EUS spectrum analysis: a validation study
- PMID: 19922913
- PMCID: PMC2900783
- DOI: 10.1016/j.gie.2009.08.027
In vivo characterization of pancreatic and lymph node tissue by using EUS spectrum analysis: a validation study
Abstract
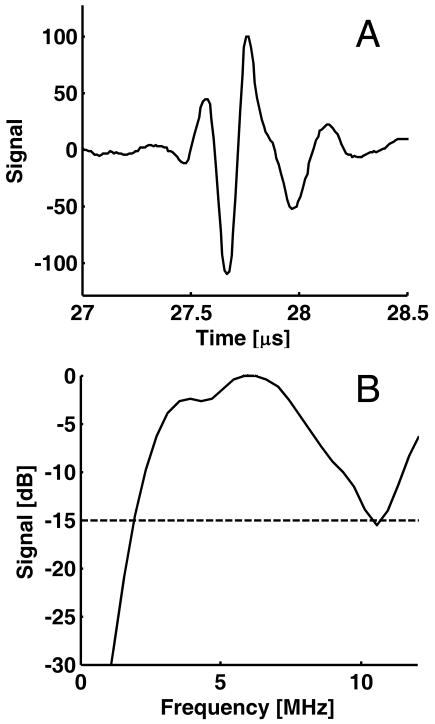
Background: Quantitative spectral analysis of the radiofrequency (RF) signals that underlie grayscale EUS images can be used to provide additional, objective information about tissue state.
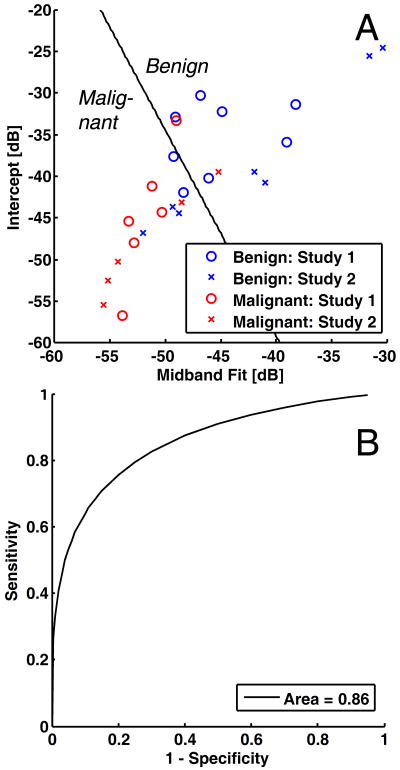
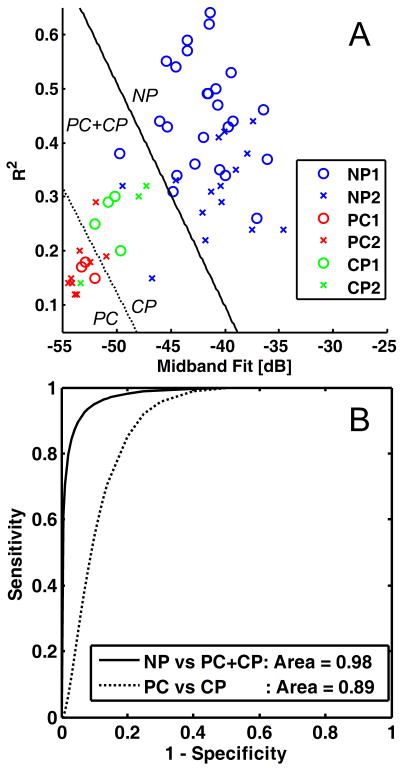
Objective: Our purpose was to validate RF spectral analysis as a method to distinguish between (1) benign and malignant lymph nodes and (2) normal pancreas, chronic pancreatitis, and pancreatic cancer.
Design and setting: A prospective validation study of eligible patients was conducted to compare with pilot study RF data.
Patients: Forty-three patients underwent EUS of the esophagus, stomach, pancreas, and surrounding intra-abdominal and mediastinal lymph nodes (19 from a previous pilot study and 24 additional patients).
Main outcome measurements: Midband fit, slope, intercept, and correlation coefficient from a linear regression of the calibrated RF power spectra were determined.
Results: Discriminant analysis of mean pilot-study parameters was then performed to classify validation-study parameters. For benign versus malignant lymph nodes, midband fit and intercept (both with t test P < .058) provided classification with 67% accuracy and area under the receiver operating curve (AUC) of 0.86. For diseased versus normal pancreas, midband fit and correlation coefficient (both with analysis of variance P < .001) provided 93% accuracy and an AUC of 0.98. For pancreatic cancer versus chronic pancreatitis, the same parameters provided 77% accuracy and an AUC of 0.89. Results improved further when classification was performed with all data.
Limitations: Moderate sample size and spatial averaging inherent to the technique.
Conclusions: This study confirms that mean spectral parameters provide a noninvasive method to quantitatively discriminate benign and malignant lymph nodes as well as normal and diseased pancreas.
2010 American Society for Gastrointestinal Endoscopy. Published by Mosby, Inc. All rights reserved.
Conflict of interest statement
Figures
Similar articles
-
Characterization of the pancreas in vivo using EUS spectrum analysis with electronic array echoendoscopes.Gastrointest Endosc. 2012 Jun;75(6):1175-83. doi: 10.1016/j.gie.2012.01.039. Epub 2012 Apr 11. Gastrointest Endosc. 2012. PMID: 22498178 Free PMC article.
-
EUS spectrum analysis for in vivo characterization of pancreatic and lymph node tissue: a pilot study.Gastrointest Endosc. 2007 Dec;66(6):1096-106. doi: 10.1016/j.gie.2007.05.052. Epub 2007 Oct 29. Gastrointest Endosc. 2007. PMID: 18028925
-
Characterization of pancreatic cancer and intra-abdominal lymph node malignancy using spectrum analysis of endoscopic ultrasound imaging.Annu Int Conf IEEE Eng Med Biol Soc. 2009;2009:1949-52. doi: 10.1109/IEMBS.2009.5333462. Annu Int Conf IEEE Eng Med Biol Soc. 2009. PMID: 19964019
-
Endoscopic ultrasound elastography: Current status and future perspectives.World J Gastroenterol. 2015 Dec 21;21(47):13212-24. doi: 10.3748/wjg.v21.i47.13212. World J Gastroenterol. 2015. PMID: 26715804 Free PMC article. Review.
-
Endoscopic ultrasound image enhancement elastography.Gastrointest Endosc Clin N Am. 2012 Apr;22(2):333-48, x-xi. doi: 10.1016/j.giec.2012.04.011. Epub 2012 May 3. Gastrointest Endosc Clin N Am. 2012. PMID: 22632955 Review.
Cited by
-
Frequency-domain analysis of photoacoustic imaging data from prostate adenocarcinoma tumors in a murine model.Ultrasound Med Biol. 2011 May;37(5):834-9. doi: 10.1016/j.ultrasmedbio.2011.01.012. Epub 2011 Mar 3. Ultrasound Med Biol. 2011. PMID: 21376447 Free PMC article.
-
Ultrasonic spectrum analysis for in vivo characterization of tumor microstructural changes in the evaluation of tumor response to chemotherapy using diagnostic ultrasound.BMC Cancer. 2013 Jun 21;13:302. doi: 10.1186/1471-2407-13-302. BMC Cancer. 2013. PMID: 23800247 Free PMC article.
-
High Frequency Spectral Ultrasound Imaging to Detect Metastasis in Implanted Biomaterial Scaffolds.Ann Biomed Eng. 2020 Jan;48(1):477-489. doi: 10.1007/s10439-019-02366-2. Epub 2019 Sep 23. Ann Biomed Eng. 2020. PMID: 31549327 Free PMC article.
-
Characterization of the pancreas in vivo using EUS spectrum analysis with electronic array echoendoscopes.Gastrointest Endosc. 2012 Jun;75(6):1175-83. doi: 10.1016/j.gie.2012.01.039. Epub 2012 Apr 11. Gastrointest Endosc. 2012. PMID: 22498178 Free PMC article.
-
The role of endoscopic ultrasound-guided fine needle aspiration (eus-fna) for the diagnosis of intra-abdominal lymphadenopathy of unknown origin.J Interv Gastroenterol. 2012 Oct;2(4):172-176. doi: 10.4161/jig.23742. Epub 2012 Oct 1. J Interv Gastroenterol. 2012. PMID: 23687604 Free PMC article.
References
-
- Rifkin MD, Ehrlich SM, Marks G. Staging of rectal carcinoma: prospective comparison of endorectal US and CT. Radiology. 1989;170:319–22. - PubMed
-
- Botet JF, Lightdale CJ, Zauber AG, Gerdes H, Winawer SJ, Urmacher C, Brennan MF. Preoperative staging of gastric cancer: comparison of endoscopic US and dynamic CT. Radiology. 1991;181:426–32. - PubMed
-
- Meyenberger C, Huch Boni RA, Bertschinger P, Zala GF, Klotz HP, Krestin GP. Endoscopic ultrasound and endorectal magnetic resonance imaging: a prospective, comparative study for preoperative staging and follow-up of rectal cancer. Endoscopy. 1995;27:469–79. - PubMed
-
- Willis S, Truong S, Gribnitz S, Fass J, Schumpelick V. Endoscopic ultrasonography in the preoperative staging of gastric cancer: accuracy and impact on surgical therapy. Surg Endosc. 2000;14:951–4. - PubMed
-
- van Vliet EP, Eijkemans MJ, Poley JW, Steyerberg EW, Kuipers EJ, Siersema PD. Staging of esophageal carcinoma in a low-volume EUS center compared with reported results from high-volume centers. Gastrointest Endosc. 2006;63:938–47. - PubMed
Publication types
MeSH terms
Grants and funding
LinkOut - more resources
Full Text Sources
Other Literature Sources
Medical
