Comparative Study
. 2010 Feb;84(3):1504-12.
doi: 10.1128/JVI.02029-09. Epub 2009 Nov 18.

Retrograde axon transport of herpes simplex virus and pseudorabies virus: a live-cell comparative analysis

Affiliations
Comparative Study

Retrograde axon transport of herpes simplex virus and pseudorabies virus: a live-cell comparative analysis

Sarah Elizabeth Antinone et al. J Virol. 2010 Feb.

Abstract

Upon entry, neuroinvasive herpesviruses traffic from axon terminals to the nuclei of neurons resident in peripheral ganglia, where the viral DNA is deposited. A detailed analysis of herpes simplex virus type 1 (HSV-1) transport dynamics in axons following entry is currently lacking. Here, time lapse fluorescence microscopy was used to compare the postentry viral transport of two neurotropic herpesviruses: HSV-1 and pseudorabies virus (PRV). HSV-1 capsid transport dynamics were indistinguishable from those of PRV and did not differ in neurons of human, mouse, or avian origin. Simultaneous tracking of capsids and tegument proteins demonstrated that the composition of actively transporting HSV-1 is remarkably similar to that of PRV. This quantitative assessment of HSV-1 axon transport following entry demonstrates that HSV-1 and PRV share a conserved mechanism for postentry retrograde transport in axons and provides the foundation for further studies of the retrograde transport process.


Figures
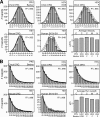
FIG. 1.
FIG. 1.
Capsid transport dynamics in axons. Neurons were infected with red fluorescent capsid strains, and retrogradely transported capsids were imaged at 10 frames/s (100-ms exposures) in a 58.5-μm by 78-μm field for as long as 1 h following infection. (A) Histograms of capsid transport velocities in which each data point is the average velocity of a moving capsid during a single run. Values on the x axis are expressed in micrometers per second. The solid curve in each panel represents the Gaussian best fit, and the dashed curves represent the 95% confidence interval. The goodness of fit is indicated by the R2 value. (B) Histograms of capsid run lengths. Values on the x axis are expressed in micrometers. The solid curve is the best-fit decaying exponential, and the dotted curves represent the 95% confidence interval. The goodness of fit is indicated by the R2 value. Values below 2 μm, which were underrepresented because our temporal resolution was insufficient to resolve short runs, were excluded from histograms and curve-fitting analyses but were included in the average run length (bar graph). Run lengths are underestimates due to the movement of particles out of the focal plane. Values above 30 μm were infrequent, in part due to the field size, and were not included in the histogram plots but were included in the average run length (bar graph). All histograms are labeled with the cell type at the top left and the viral strain at the top right. Bar graphs represent average capsid velocities (A) and run lengths (B). Letters above bars indicate the neuronal cell type (C, chick DRG; M, mouse DRG; H, human SK-N-SH).
FIG. 2.
FIG. 2.
Frequency of capsid transport in axons. Chick sensory DRG neurons were infected with mRFP1-capsid strains, and 37 to 40 recordings were captured within the first hour postinfection for each virus. Time lapse recordings were captured at 10 frames/s (100-ms exposures) for 50-s intervals. The frequency of transport is reported as the average number of capsids entering a 58.5-μm by 78-μm field per minute. Error bars represent the standard errors of the means.
FIG. 3.
FIG. 3.
Viral spread in Vero cells. The diameters of 25 plaques resulting from infection with each recombinant viral strain were measured. All viruses encode mRFP1-VP26 (red capsid) and GFP fused to the indicated tegument protein. Plaque diameters are presented relative to that of an unmodified HSV-1 F strain (considered the wild type [WT] and assigned a value of 100%). Error bars represent the standard errors of the means.
FIG. 4.
FIG. 4.
Fluorescent fusion protein expression. Lysates from infected Vero cells were probed with an anti-GFP antibody and subjected to Western blot analysis. Labels at the top of the gel indicate the encoded GFP fusions. All strains additionally encode mRFP1-VP26 (red capsid). All lysates were loaded equally except for the VP1/2-GFP strain lysate, which was eight times more concentrated.
FIG. 5.
FIG. 5.
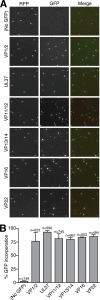
Incorporation of fluorescent fusion proteins into extracellular viral particles. (A) Imaging of individual fluorescent viral particles released from infected Vero cells at 2 to 3 days postinfection. Examples of mRFP1 and GFP emissions from 30-μm by 30-μm fields are shown. Viruses encode mRFP1-VP26 (red capsid) and GFP fused to the indicated tegument protein. (B) Fractions of mRFP1 particles that emit GFP fluorescence, as illustrated in panel A. The encoded GFP fusions are given below the graph. Results shown are averages for three independent experiments, and error bars represent standard deviations (n, number of capsids).
FIG. 6.
FIG. 6.
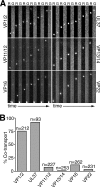
Retrograde capsid and tegument protein transport in axons. (A) Chick sensory DRG neurons were infected with a virus encoding mRFP1-VP26 (red capsid) and GFP fused to the indicated tegument protein. Axons were imaged during the first hour following infection. Frames of alternating mRFP1 (R) and GFP (G) emissions were captured with continuous 100-ms exposures. Each montage shows an individual mRFP1-capsid moving upward (toward the cell body). Frames were 2.3 μm by 20.5 μm. (B) Fractions of mRFP1-capsids that are cotransported with the indicated GFP fusion proteins (n, number of capsids tracked).
FIG. 7.
FIG. 7.
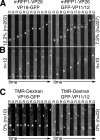
Documentation of low-frequency tegument transport events following infection of chick sensory DRG neurons. (A and B) VP16 and VP11/12 GFP fusion proteins were infrequently observed moving in association with (A) and independently of (B) transporting capsids. Each montage represents individual fluorescent signals moving toward the cell body. (C) Sensory DRG neurons were stained with TMR-dextran to label endocytic vesicles. Labeled neurons were infected with the indicated monofluorescent GFP-tegument virus and were imaged for the first hour following infection. GFP fusion proteins in transport were not detected in association with labeled endosomes, although endosomes were observed to move retrogradely (an example is seen in the VP11/12 panel). All frames were 2.3 μm by 20.5 μm.
FIG. 8.
FIG. 8.
Capsid and tegument protein accumulation at the nuclear rims of infected sensory DRG neurons following transport. Chick sensory DRG neurons were infected with HSV-1 encoding mRFP1-VP26 (red capsid) and GFP fused to the indicated tegument protein. A minimum of 13 nuclei present in the center of the DRG explant were imaged from 2 to 3 h postinfection. Differential interference contrast (DIC) and fluorescence images of representative nuclei are shown. The percentages of capsids that also emit green fluorescence are given below the images (n, number of capsids). All images were 14.4 μm by 14.4 μm.

References

    1. Antinone, S. E., G. T. Shubeita, K. E. Coller, J. I. Lee, S. Haverlock-Moyns, S. P. Gross, and G. A. Smith. 2006. The herpesvirus capsid surface protein, VP26, and the majority of the tegument proteins are dispensable for capsid transport toward the nucleus. J. Virol. 80:5494-5498. - PMC - PubMed
    1. Antinone, S. E., and G. A. Smith. 2006. Two modes of herpesvirus trafficking in neurons: membrane acquisition directs motion. J. Virol. 80:11235-11240. - PMC - PubMed
    1. Batterson, W., D. Furlong, and B. Roizman. 1983. Molecular genetics of herpes simplex virus. VIII. Further characterization of a temperature-sensitive mutant defective in release of viral DNA and in other stages of the viral reproductive cycle. J. Virol. 45:397-407. - PMC - PubMed
    1. Bearer, E. L., X. O. Breakefield, D. Schuback, T. S. Reese, and J. H. LaVail. 2000. Retrograde axonal transport of herpes simplex virus: evidence for a single mechanism and a role for tegument. Proc. Natl. Acad. Sci. U. S. A. 97:8146-8150. - PMC - PubMed
    1. Blyth, W. A., D. A. Harbour, and T. J. Hill. 1984. Pathogenesis of zosteriform spread of herpes simplex virus in the mouse. J. Gen. Virol. 65:1477-1486. - PubMed

Publication types

LinkOut - more resources