Heterogeneity of membrane properties in sympathetic preganglionic neurons of neonatal mice: evidence of four subpopulations in the intermediolateral nucleus
- PMID: 19923248
- PMCID: PMC2807234
- DOI: 10.1152/jn.00622.2009
Heterogeneity of membrane properties in sympathetic preganglionic neurons of neonatal mice: evidence of four subpopulations in the intermediolateral nucleus
Abstract
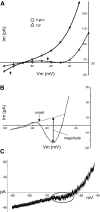
Spinal cord sympathetic preganglionic neurons (SPNs) integrate activity from descending and sensory systems to determine the final central output of the sympathetic nervous system. The intermediolateral column (IML) has the highest number and density of SPNs and, within this region, SPN somas are found in distinct clusters within thoracic and upper lumbar spinal segments. Whereas SPNs exhibit a rostrocaudal gradient of end-target projections, individual clusters contain SPNs with diverse functional roles. Here we explored diversity in the electrophysiological properties observed in Hb9-eGFP-identified SPNs in the IML of neonatal mice. Overall, mouse SPN intrinsic membrane properties were comparable with those seen in other species. A wide range of values was obtained for all measured properties (up to a 10-fold difference), suggesting that IML neurons are highly differentiated. Using linear regression we found strong correlations between many cellular properties, including input resistance, rheobase, time constant, action potential shape, and degree of spike accommodation. The best predictor of cell function was rheobase, which correlated well with firing frequency-injected current (f-I) slopes as well as other passive and active membrane properties. The range in rheobase suggests that IML neurons have a recruitment order with stronger synaptic drives required for maximal recruitment. Using cluster analysis, we identified at least four subpopulations of SPNs, including one with a long time constant, low rheobase, and high f-I gain. We thus propose that the IML contains populations of neurons that are differentiable by their membrane properties and hypothesize they represent diverse functional classes.
Figures


Similar articles
-
Membrane properties and dendritic arborization of the intermediolateral nucleus neurons in the guinea-pig thoracic spinal cord in vitro.J Auton Nerv Syst. 1993 May;43(2):97-106. doi: 10.1016/0165-1838(93)90346-v. J Auton Nerv Syst. 1993. PMID: 8326100
-
Active and passive membrane properties of rat sympathetic preganglionic neurones innervating the adrenal medulla.J Physiol. 2002 Dec 15;545(3):945-60. doi: 10.1113/jphysiol.2002.023390. J Physiol. 2002. PMID: 12482898 Free PMC article.
-
The intermediolateral cell column of the thoracic spinal cord is comprised of target-specific subnuclei: evidence from retrograde transport studies and immunohistochemistry.J Neurosci. 1988 May;8(5):1767-75. doi: 10.1523/JNEUROSCI.08-05-01767.1988. J Neurosci. 1988. PMID: 2896766 Free PMC article.
-
Effects of putative neurotransmitters on sympathetic preganglionic neurons.Annu Rev Physiol. 1988;50:553-64. doi: 10.1146/annurev.ph.50.030188.003005. Annu Rev Physiol. 1988. PMID: 2897828 Review.
-
Sympathetic preganglionic neurons: properties and inputs.Compr Physiol. 2015 Apr;5(2):829-69. doi: 10.1002/cphy.c140020. Compr Physiol. 2015. PMID: 25880515 Review.
Cited by
-
Monoaminergic modulation of spinal viscero-sympathetic function in the neonatal mouse thoracic spinal cord.PLoS One. 2012;7(11):e47213. doi: 10.1371/journal.pone.0047213. Epub 2012 Nov 5. PLoS One. 2012. PMID: 23144807 Free PMC article.
-
Brainstem noradrenergic neurons: Identifying a hub at the intersection of cognition, motility, and skeletal muscle regulation.Acta Physiol (Oxf). 2022 Nov;236(3):e13887. doi: 10.1111/apha.13887. Epub 2022 Sep 15. Acta Physiol (Oxf). 2022. PMID: 36073023 Free PMC article. Review.
-
Dramatically Amplified Thoracic Sympathetic Postganglionic Excitability and Integrative Capacity Revealed with Whole-Cell Patch-Clamp Recordings.eNeuro. 2019 May 13;6(2):ENEURO.0433-18.2019. doi: 10.1523/ENEURO.0433-18.2019. Print 2019 Mar/Apr. eNeuro. 2019. PMID: 31040159 Free PMC article.
-
Neuroanatomical and neurochemical atlas of the spiny mouse (Acomys cahirinus) spinal cord.Brain Struct Funct. 2025 Jul 28;230(7):124. doi: 10.1007/s00429-025-02982-w. Brain Struct Funct. 2025. PMID: 40719809
-
Mapping the cellular electrophysiology of rat sympathetic preganglionic neurones to their roles in cardiorespiratory reflex integration: a whole cell recording study in situ.J Physiol. 2014 May 15;592(10):2215-36. doi: 10.1113/jphysiol.2014.270769. Epub 2014 Mar 24. J Physiol. 2014. PMID: 24665100 Free PMC article.
References
-
- Anderson CR, McLachlan EM, Srb-Christie O. Distribution of sympathetic preganglionic neurons and monoaminergic nerve terminals in the spinal cord of the rat. J Comp Neurol 283: 269–284, 1989 - PubMed
-
- Björklund A, Skagerberg G. Evidence for a major spinal cord projection from the diencephalic A11 dopamine cell group in the rat using transmitter-specific fluorescent retrograde tracing. Brain Res 177: 170–175, 1979 - PubMed
-
- Black IB. Regulation of autonomic development. Annu Rev Neurosci 1: 183–214, 1978 - PubMed
-
- Black IB, Hendry IA, Iversen LL. Trans-synaptic regulation of growth and development of adrenergic neurones in a mouse sympathetic ganglion. Brain Res 34: 229–240, 1971 - PubMed
Publication types
MeSH terms
Substances
Grants and funding
LinkOut - more resources
Full Text Sources

