Comparative Study
. 2009 Nov 18;29(46):14423-38.
doi: 10.1523/JNEUROSCI.2604-09.2009.

Orexin/hypocretin and histamine: distinct roles in the control of wakefulness demonstrated using knock-out mouse models

Affiliations
Comparative Study

Orexin/hypocretin and histamine: distinct roles in the control of wakefulness demonstrated using knock-out mouse models

Christelle Anaclet et al. J Neurosci. .

Abstract

To determine the respective role played by orexin/hypocretin and histamine (HA) neurons in maintaining wakefulness (W), we characterized the behavioral and sleep-wake phenotypes of orexin (Ox) knock-out (-/-) mice and compared them with those of histidine-decarboxylase (HDC, HA-synthesizing enzyme)-/- mice. While both mouse strains displayed sleep fragmentation and increased paradoxical sleep (PS), they presented a number of marked differences: (1) the PS increase in HDC(-/-) mice was seen during lightness, whereas that in Ox(-/-) mice occurred during darkness; (2) contrary to HDC(-/-), Ox(-/-) mice had no W deficiency around lights-off, nor an abnormal EEG and responded to a new environment with increased W; (3) only Ox(-/-), but not HDC(-/-) mice, displayed narcolepsy and deficient W when faced with motor challenge. Thus, when placed on a wheel, wild-type (WT), but not littermate Ox(-/-) mice, voluntarily spent their time in turning it and as a result, remained highly awake; this was accompanied by dense c-fos expression in many areas of their brains, including Ox neurons in the dorsolateral hypothalamus. The W and motor deficiency of Ox(-/-) mice was due to the absence of Ox because intraventricular dosing of orexin-A restored their W amount and motor performance whereas SB-334867 (Ox1-receptor antagonist, i.p.) impaired W and locomotion of WT mice during the test. These data indicate that Ox, but not HA, promotes W through enhanced locomotion and suggest that HA and Ox neurons exert a distinct, but complementary and synergistic control of W: the neuropeptide being more involved in its behavioral aspects, whereas the amine is mainly responsible for its qualitative cognitive aspects and cortical EEG activation.


Figures
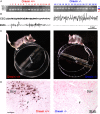
Figure 1.
Figure 1.
Illustration of the experimental procedures. A, PCR genotyping of mouse tail DNA showing the presence of prepro-orexin gene (400 pbs) in the WT mice (animals 1–15) and its absence (replaced by a 600 pbs allele) in their KO littermates (animals 16–30). B, Simultaneous recording of cortical EEG and EMG in WT and orexin KO littermates during baseline conditions or after behavioral (such as the wheel test in C) or pharmacological tests. C, Illustration of our wheel test and the placement of mice on the wheels during the test with simultaneous EEG and EMG recordings (B). This was followed by immunohistochemical tests, such as that of orexin (D), and/or that of c-fos (see Fig. 8). DLH, Dorsolateral hypothalamic area; F, fornix.
Figure 2.
Figure 2.
A, Comparison of mean hourly amount (±SEM in min) of the spontaneous sleep–wake states between Ox+/+ and Ox−/− littermates. The inserted histograms correspond to the light/dark (L/D) ratio of the amount of each sleep–wake state. Note that Ox−/− mice exhibit (1) an increase in the hourly amounts of W during the light period, resulting in a decrease in D/L ratio of W; (2) a decrease in hourly amounts of PS during the light period, and an increase during the dark period, resulting in a marked decrease in the PS L/D ratio; (3) a decrease in the SWS L/D ratio, that is, however, not statistically significant; (4) narcoleptic episodes in Ox−/− mice, occurring almost exclusively during the darkness. See also Table 1. B, Total W, SWS, PS and narcolepsy amount during the lightness and darkness and over 24 h. n = 30, corresponding to 2 × 24 h recordings for 15 animals of each genotype. *p < 0.05; **p < 0.01; ***p < 0.001, using a two-tailed t test after significance in a two-way ANOVA for repeated measures.
Figure 3.
Figure 3.
Mean spectral distribution of cortical EEG power density during the spontaneous sleep–wake states (A, C, D) or the waking state during a wheel test (B) in Ox+/+ and Ox−/− mice. The data were obtained from 9 pairs of littermates by pooling consecutive 4 s epochs during the period of 7:00–10:00 P.M. using the fast Fourier transform routine within the frequency range of 0.5–60 Hz. A–D, Mean percentage power density calculated as the mean power (in square microvolts) in each 0.4 Hz frequency bin divided by the total power (0.5–60 Hz) in the same epoch. E, Cortical EEG SWS/W (top) and SWS/PS (bottom) power ratio (0.5–60 Hz). The inset histograms in A–D correspond to the EEG power spectra in δ (0.5–3.5 Hz), slow θ (sθ, 3.5–5.5 Hz), fast θ (fθ, 5.5–11 Hz), α (or spindle, 11–20 Hz), and β+γ (20–60 Hz). Note, between the two genotypes, (1) the virtually similar morphology of EEG spectra during spontaneous W, SWS, and PS (A, C, D); (2) the lack of significant difference in α, β, θ, δ, and γ bands during W, SWS, and PS (A, C, D); (3) an unchanged cortical EEG SWS/W or SWS/PS power ratio in Ox−/− mice compared with their WT littermates in baseline conditions (E); and (4) an increase in slow θ band and a decrease in fast θ band in the KO mice compared with their WT littermates during the wheel test (B).
Figure 4.
Figure 4.
Effects of an environmental change on the sleep–wake states in Ox+/+ and Ox−/− mice. A, Typical examples of polygraphic recording and corresponding hypnograms showing the effects of an environmental change on the cortical EEG and EMG and sleep–wake cycle. The environmental change (indicated by an arrow) consisted of moving the animals from their habitual transparent barrel cages to an opaque rectangular cage between 2:00 and 6:00 P.M. B, Quantitative variations of the sleep–wake states. Mean values ± SEM (minutes) of each sleep–wake stage of the mice during their 4 h stay in the new environment are compared with those of their own baseline recordings. C, Sleep–wake percentage changes relative to the baseline value (0 axis) for the same group. Note that (1) there was a significant increase in W and decrease in SWS in Ox+/+ and Ox−/− mice compared with their own baseline values (A, B), whereas PS decreased only in Ox+/+ mice; and (2) the sleep–wake changes in Ox+/+ mice are significantly greater than those in Ox−/− mice (C). n = 18 from 9 pairs of animals. °p > 0.05; *p < 0.05; **p < 0.01; ***p < 0.001; ****p < 0.0001, two-tailed t test after significance in a two-way ANOVA for repeated measures.
Figure 5.
Figure 5.
Effect of a wheel test on the sleep–wake states and locomotion in HDC+/+ or HDC−/− mice. A, Typical examples of polygraphic recording and corresponding hypnograms illustrating the effects of a wheel test on the cortical EEG and EMG and sleep–wake cycle in an HDC+/+ or HDC−/− mouse. The wheel test consisted of placing the animals on a wheel between 2:00 and 6:00 P.M. B, Effect of the wheel test on the locomotion (number of wheel turns) in HDC+/+ and HDC−/− mice. C, Quantitative variations of the sleep–wake states. Mean values ± SEM (minutes) of each sleep–wake stage of the mice during their 4 h stay on the wheel are compared with those of their own baseline recordings. c, Sleep–wake percentage changes relative to the baseline value (0 axis) of the same group. Note that (1) there was a significant increase in W and decrease in SWS and PS in both HDC+/+ and HDC−/− mice compared with their own baseline values (A, C); (2) the wheel test induced no significantly different sleep–wake effects between the two genotypes (c); and (3) the wheel test induced a similar effect on the locomotion between the two genotypes (B). n = 18 from 6 pairs of animals. °p > 0.05; *p < 0.05; **p < 0.01; ***p < 0.001; ****p < 0.0001, two-tailed t test after significance in a two-way ANOVA for repeated measures.
Figure 6.
Figure 6.
Typical examples of polygraphic recording (EEG and EMG) and corresponding hypnograms illustrating the effects of a wheel test, alone or combined with pharmacological dosing, on the locomotion and sleep–wake states in Ox+/+ and Ox−/− mice. A, Wheel test alone. Note a much larger amount of wheel turns and W in Ox+/+ mice than Ox−/− mice. B, Wheel test coupled with intracerebroventricular injection of Ox-A at a dose of 3 μg. Note that, after dosing, the Ox+/+ mouse maintained its high amount of locomotion and W, whereas the Ox−/− mouse showed a remarkable improvement of W and number of wheel turns (compare B with A) and that the amount of locomotion and W in the Ox−/− mouse became similar to that of the Ox+/+ mouse. C, Wheel test coupled with intraperitoneal injection of SB-334867 (Ox-1 receptor antagonist) at a dose of 30 mg/kg. Note that the antagonist impaired the wheel test-induced locomotion and W only in the Ox+/+ mouse (compare C with A).
Figure 7.
Figure 7.
Comparison of the effects of a wheel test, alone or combined with pharmacological dosing, on the locomotion and sleep–wake states in Ox+/+ and Ox−/− mice. A, Wheel test alone. Note (1) a significant increase in W and a significant decrease in SWS and PS in both Ox+/+ and Ox−/− mice during the wheel test lasting 4 h compared with their own baseline values, and (2) a significantly higher amount of wheel turns in Ox+/+ than in Ox−/− mice. a, Sleep–wake percentage changes relative to the baseline value (0 axis) for each mouse genotype. Note that the sleep–wake changes during the wheel test are highly significantly smaller in Ox−/− than in Ox+/+ mice. n = 39 tests in 13 pairs of mice. B, Wheel test coupled with intracerebroventricular injection of Ox-A at a dose of 3 μg. Note that the agonist significantly increased W and locomotion and decreased SWS and PS in Ox−/− mice during the wheel test but had no effect in Ox+/+ mice. n = 16 tests from 8 mice of each genotype. C, Wheel test coupled with intraperitoneal injection of SB-334867 (Ox-1 receptor antagonist) at a dose of 30 mg/kg. Note that the antagonist significantly decreased W and locomotion and increased SWS and PS in Ox+/+ mice during the wheel test but had no effect in Ox−/− mice. n = 24 injections performed in 12 mice of each genotype. °p > 0.05; *p < 0.05; **p < 0.01; ***p < 0.001; ****p < 0.0001, two-tailed t test after significance in a two-way ANOVA for repeated measures.
Figure 8.
Figure 8.
Effects of a wheel test on c-fos expression in the Ox+/+ and Ox−/− mouse brains. A, Photomicrographs illustrating the distribution of Fos-immunoreactive neurons in the cerebral cortices. Examples of frontal sections across the primary motor cortex (M1) and somatosensory 1 cortex (barrel field, S1BF) are shown. The anatomical location of the two photomicrographs is indicated by the schematic frontal sections (left, lower). Note, in both structures, a remarkably higher density of c-fos labeling in the Ox+/+ than in the Ox−/− mouse cortices following a 2 h stay on the wheel. B, Camera lucida drawing of frontal sections showing the distribution of simple Fos (black dots)- or Ox (green dots)-immunoreactive cells and double Fos- and Ox-immunoreactive neurons (red dots) in the posterior hypothalamus. The upper right examples in the photomicrograph (a and a1) are made from the dorsolateral hypothalamic area (DLH), indicated by a blue inset from the rostral sections of the posterior hypothalamus (b and b1). Note, after a 2 h stay on the wheel, 1) that large c-fos labeling in the DLH is Ox-immunoreactive and that the great majority of Ox-containing neurons (stained brown) shows c-fos labeling (black nuclei) in the Ox+/+ mouse (a–d), and (2) that in the Ox−/− mouse (a1–d1), no Ox-immunoreactive cell is detected (see also Fig. 1D), but an important c-fos labeling is present. 3V, Third ventricle; aca, anterior commissure, anterior; Arc, arcuate hypothalamic nucleus; cc, corpus callosum; D3V, dorsal third ventricle; DM, dorsomedial hypothalamic nucleus; f, fornix; ic, internal capsule; LV, lateral ventricle; M2, secondary motor cortex; opt, optic tract; VMH, ventromedial hypothalamic nucleus. Bars, 0.1 mm (left) and 0.5 mm (right).

Comment in

Similar articles

Cited by

References

    1. Anaclet C, Parmentier R, Guidon G, Buda C, Sastre JP, Haas HL, Lin JS. Respective role of histamine and orexin neurons in sleep-wake control. Sleep. 2007;30(Suppl):A24.
    1. Bayer L, Eggermann E, Serafin M, Saint-Mleux B, Machard D, Jones B, Mühlethaler M. Orexins (hypocretins) directly excite tuberomammillary neurons. Eur J Neurosci. 2001;14:1571–1575. - PubMed
    1. Chemelli RM, Willie JT, Sinton CM, Elmquist JK, Scammell T, Lee C, Richardson JA, Williams SC, Xiong Y, Kisanuki Y, Fitch TE, Nakazato M, Hammer RE, Saper CB, Yanagisawa M. Narcolepsy in orexin knockout mice: molecular genetics of sleep regulation. Cell. 1999;98:437–451. - PubMed
    1. de Lecea L, Kilduff TS, Peyron C, Gao X, Foye PE, Danielson PE, Fukuhara C, Battenberg EL, Gautvik VT, Bartlett FS, 2nd, Frankel WN, van den Pol AN, Bloom FE, Gautvik KM, Sutcliffe JG. The hypocretins: hypothalamus-specific peptides with neuroexcitatory activity. Proc Natl Acad Sci U S A. 1998;95:322–327. - PMC - PubMed
    1. Duxon MS, Stretton J, Starr K, Jones DN, Holland V, Riley G, Jerman J, Brough S, Smart D, Johns A, Chan W, Porter RA, Upton N. Evidence that orexin-A-evoked grooming in the rat is mediated by orexin-1 (OX1) receptors, with downstream 5-HT2C receptor involvement. Psychopharmacology (Berl) 2001;153:203–209. - PubMed

Publication types

MeSH terms