. 2010 Feb;298(2):R312-9.
doi: 10.1152/ajpregu.00425.2009. Epub 2009 Nov 18.

Magnetic resonance imaging of hypoxic injury to the murine placenta

Affiliations

Magnetic resonance imaging of hypoxic injury to the murine placenta

Tracy M Tomlinson et al. Am J Physiol Regul Integr Comp Physiol. 2010 Feb.

Abstract

We assessed the use of magnetic resonance imaging (MRI) to define placental hypoxic injury associated with fetal growth restriction. On embryonic day 18.5 (E18.5) we utilized dynamic contrast-enhanced (DCE)-MRI on a 4.7-tesla small animal scanner to examine the uptake and distribution of gadolinium-based contrast agent. Quantitative DCE parameter analysis was performed for the placenta and fetal kidneys of three groups of pregnant C57BL/6 mice: 1) mice that were exposed to Fi(O(2)) = 12% between E15.5 and E18.5, 2) mice in normoxia with food restriction similar to the intake of hypoxic mice between E15.5 and E18.5, and 3) mice in normoxia that were fed ad libitum. After imaging, we assessed fetoplacental weight, placental histology, and gene expression. We found that dams exposed to hypoxia exhibited fetal growth restriction (weight reduction by 28% and 14%, respectively, P < 0.05) with an increased placental-to-fetal ratio. By using MRI-based assessment of placental contrast agent kinetics, referenced to maternal paraspinous muscle, we found decreased placental clearance of contrast media in hypoxic mice, compared with either control group (61%, P < 0.05). This was accompanied by diminished contrast accumulation in the hypoxic fetal kidneys (23%, P < 0.05), reflecting reduced transplacental gadolinium transport. These changes were associated with increased expression of placental Phlda2 and Gcm1 transcripts. Exposure to hypoxia near the end of mouse pregnancy reduces placental perfusion and clearance of contrast. MRI-based DCE imaging provides a novel tool for dynamic, in vivo assessment of placental function.


Figures
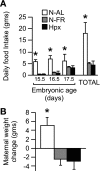
Fig. 1.
Fig. 1.
Influence of hypoxia on dams' food intake and weight change. A: daily food intake in grams for each experimental group during the 3 experimental days (E15.5–E18.5, n = 7 for N-AL, n = 15 for N-FR, and n = 16 for Hpx). B: dams' weight change during the 3 experimental days (E15.5–E18.5, n = 8 for N-AL, n = 11 for N-FR, and n = 8 for Hpx). N-AL, normoxia ad libitum group; N-FR, normoxia food-restricted group; Hpx, hypoxic group. Values are means ± SD; *P < 0.05 compared with the other paradigms (ANOVA with Bonferroni correction for multiple comparisons).
Fig. 2.
Fig. 2.
Influence of hypoxia on fetal and placental weight. Measurements were performed during E15.5–E18.5 (n = 113 for N-AL, n = 99 for N-FR, and n = 126 for Hpx). Values are means ± SD; *P < 0.05 compared with the other paradigms (ANOVA with Bonferroni correction for multiple comparisons).
Fig. 3.
Fig. 3.
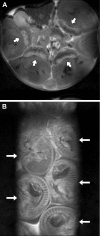
Representative 4.7 tesla in vivo MRI images of control (N-AL) mice on E18.5. Respiratory-gated spin-echo images were collected following intraperitoneal administration of the contrast agent. Transaxial image of murine placentas (A; arrows) and coronal image of murine fetuses (B; arrows) are shown. Enhancement of the chorionic plate preceded enhancement of the remainder of the placental parenchyma and occurred within 30 s of contrast agent injection in all 3 experimental groups.
Fig. 4.
Fig. 4.
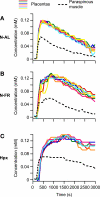
Effect of hypoxia on placental and paraspinous muscle contrast kinetic curves. Each dynamic contrast-enhanced (DCE) time course curve represents 1 dam and a set of placentas from that dam for 1 of the 3 experimental groups, showing the concentration of gadolinium contrast in these tissues during the course of imaging. Solid color lines represent different placentas within each dam. For each dam, an average concentration vs. time curve was computed for all placentas in that dam. Individual placental concentration vs. time curves were normalized based upon this average concentration curve, as detailed in the text. Note that negative concentration values immediately after contrast administration stem from a T2* effect (signal loss due to magnetic susceptibility), associated with the bolus of gadolinium.
Fig. 5.
Fig. 5.
DCE-MRI images (4.7 tesla) of control (N-AL) and hypoxic (Hpx) E18.5 mice. Images of a control mouse (A and B) and a Hpx mouse (C and D) are shown. A and C were collected at ∼400 s after injection of contrast agent [corresponding to ∼600 s (peak intensity) in the uptake curves of Fig. 4]. B and D were collected at ∼2,200 s postinjection. The diminished clearance of the contrast agent from placentas in the Hpx mouse (D) relative to the N-AL (B) is clearly evident in the later time images (arrows).
Fig. 6.
Fig. 6.
Effect of hypoxia on contrast agent concentration in the fetal kidney. Values were determined as total area under the curve (AUC) calculated for each fetal kidney, normalized to the placental AUC of the same fetus as defined in materials and methods. Values are means ± SD, n = 34 for N-AL, n = 32 for N-FR, and n = 38 for Hpx. *P < 0.05 compared with the N-AL paradigm (ANOVA with Bonferroni correction for multiple comparisons).
Fig. 7.
Fig. 7.
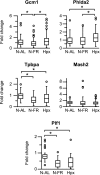
Influence of hypoxia on placental gene expression. Quantitative RT-PCR for genes expressed in the murine placenta performed on RNA prepared from E18.5 placentas from each experimental group (n = 74–98 for Gcm1, Phlda2, and Mash2; n = 32–47 for Tpbpa and Plf1). Each fold change was calculated as relative transcript expression in the placenta vs. control (N-AL). Data are expressed as box plots showing median value, upper and lower quartiles, range, and outliers. *P < 0.05 (ANOVA with Bonferroni correction for multiple comparisons).

References

    1. Abramowicz JS, Sheiner E. In utero imaging of the placenta: importance for diseases of pregnancy. Placenta 28, Suppl A: S14–S22 , 2007 - PubMed
    1. Adamson SL, Lu Y, Whiteley KJ, Holmyard D, Hemberger M, Pfarrer C, Cross JC. Interactions between trophoblast cells and the maternal and fetal circulation in the mouse placenta. Dev Biol 250: 358– 373, 2002 - PubMed
    1. Anson-Cartwright L, Dawson K, Holmyard D, Fisher SJ, Lazzarini RA, Cross JC. The glial cells missing-1 protein is essential for branching morphogenesis in the chorioallantoic placenta. Nat Genet 25: 311– 314, 2000 - PubMed
    1. Antonson P, Schuster GU, Wang L, Rozell B, Holter E, Flodby P, Treuter E, Holmgren L, Gustafsson JA. Inactivation of the nuclear receptor coactivator RAP250 in mice results in placental vascular dysfunction. Mol Cell Biol 23: 1260– 1268, 2003 - PMC - PubMed
    1. Apostolidou S, Abu-Amero S, O'Donoghue K, Frost J, Olafsdottir O, Chavele KM, Whittaker JC, Loughna P, Stanier P, Moore GE. Elevated placental expression of the imprinted PHLDA2 gene is associated with low birth weight. J Mol Med 85: 379– 387, 2007 - PubMed

Publication types

MeSH terms