

Species-specific differences in the expression of the HNF1A, HNF1B and HNF4A genes
- PMID: 19924231
- PMCID: PMC2773013
- DOI: 10.1371/journal.pone.0007855
Species-specific differences in the expression of the HNF1A, HNF1B and HNF4A genes
Abstract
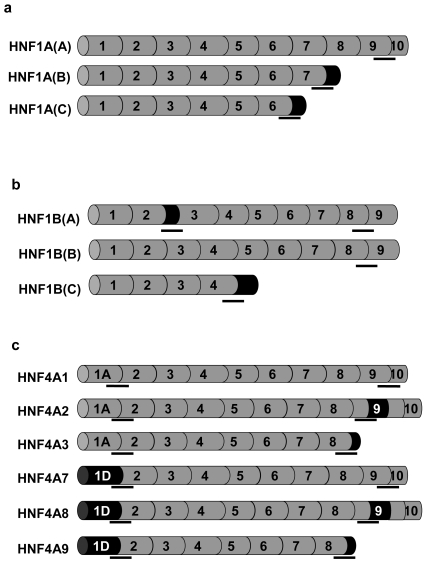
Background: The HNF1A, HNF1B and HNF4A genes are part of an autoregulatory network in mammalian pancreas, liver, kidney and gut. The layout of this network appears to be similar in rodents and humans, but inactivation of HNF1A, HNF1B or HNF4A genes in animal models cause divergent phenotypes to those seen in man. We hypothesised that some differences may arise from variation in the expression profile of alternatively processed isoforms between species.
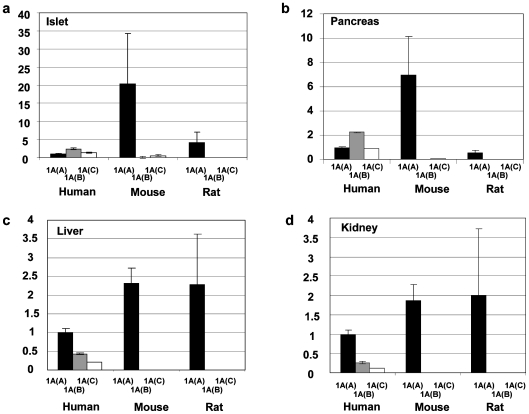
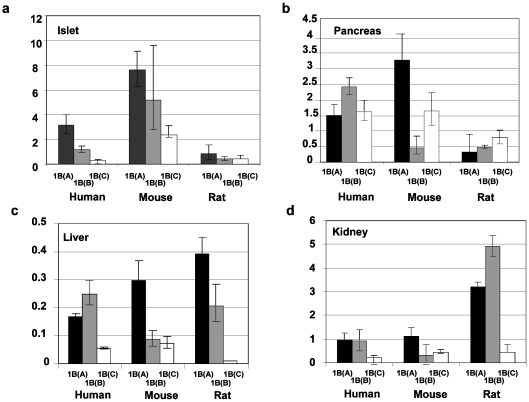
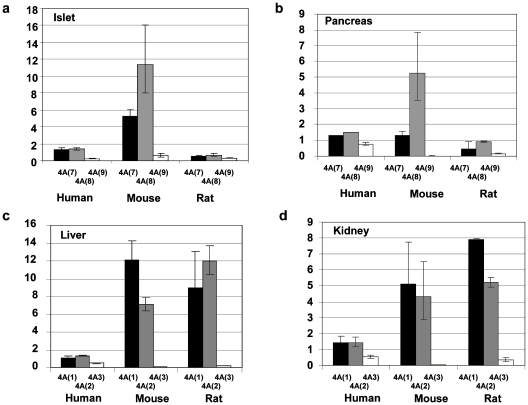
Methodology/principal findings: We measured the expression of the major isoforms of the HNF1A, HNF1B and HNF4A genes in human and rodent pancreas, islet, liver and kidney by isoform-specific quantitative real-time PCR and compared their expression by the comparative Ct (DeltaDeltaCt) method. We found major changes in the expression profiles of the HNF genes between humans and rodents. The principal difference lies in the expression of the HNF1A gene, which exists as three isoforms in man, but as a single isoform only in rodents. More subtle changes were to the balance of HNF1B and HNF4A isoforms between species; the repressor isoform HNF1B(C) comprised only 6% in human islets compared with 24-26% in rodents (p = 0.006) whereas HNF4A9 comprised 22% of HNF4A expression in human pancreas but only 11% in rodents (p = 0.001).
Conclusions/significance: The differences we note in the isoform-specific expression of the human and rodent HNF1A, HNF1B and HNF4A genes may impact on the absolute activity of these genes, and therefore on the activity of the pancreatic transcription factor network as a whole. We conclude that alterations to expression of HNF isoforms may underlie some of the phenotypic variation caused by mutations in these genes.
Conflict of interest statement
Figures
References
-
- Owen K, Hattersley AT. Maturity-onset diabetes of the young: from clinical description to molecular genetic characterization. Best Pract Res Clin Endocrinol Metab. 2001;15:309–323. - PubMed
-
- Ellard S, Colclough K. Mutations in the genes encoding the transcription factors Hepatocyte Nuclear Factor 1 Alpha (HNF-1a) and 4 Alpha (HNF-4a) in Maturity-Onset Diabetes of the Young. Mutation Research. 2006;27:854–869. - PubMed
-
- Dukes ID, Sreenan S, Roe MW, Levisetti M, Zhou YP, et al. Defective pancreatic beta-cell glycolytic signaling in hepatocyte nuclear factor-1alpha-deficient mice. Journal of Biological Chemistry. 1998;273:24457–24464. - PubMed
Publication types
MeSH terms
Substances
Grants and funding
LinkOut - more resources
Full Text Sources
Other Literature Sources
