. 2009 Nov 16;4(11):e7859.
doi: 10.1371/journal.pone.0007859.

New mouse lines for the analysis of neuronal morphology using CreER(T)/loxP-directed sparse labeling

Affiliations

New mouse lines for the analysis of neuronal morphology using CreER(T)/loxP-directed sparse labeling

Tudor C Badea et al. PLoS One. .

Abstract

Background: Pharmacologic control of Cre-mediated recombination using tamoxifen-dependent activation of a Cre-estrogen receptor ligand binding domain fusion protein [CreER(T)] is widely used to modify and/or visualize cells in the mouse.

Methods and findings: We describe here two new mouse lines, constructed by gene targeting to the Rosa26 locus to facilitate Cre-mediated cell modification. These lines should prove particularly useful in the context of sparse labeling experiments. The R26rtTACreER line provides ubiquitous expression of CreER under transcriptional control by the tetracycline reverse transactivator (rtTA); dual control by doxycycline and tamoxifen provides an extended dynamic range of Cre-mediated recombination activity. The R26IAP line provides high efficiency Cre-mediated activation of human placental alkaline phosphatase (hPLAP), complementing the widely used, but low efficiency, Z/AP line. By crossing with mouse lines that direct cell-type specific CreER expression, the R26IAP line has been used to produce atlases of labeled cholinergic and catecholaminergic neurons in the mouse brain. The R26IAP line has also been used to visualize the full morphologies of retinal dopaminergic amacrine cells, among the largest neurons in the mammalian retina.

Conclusions: The two new mouse lines described here expand the repertoire of genetically engineered mice available for controlled in vivo recombination and cell labeling using the Cre-lox system.


Conflict of interest statement

Competing Interests: The authors have declared that no competing interests exist.

Figures

Figure 1
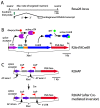
Figure 1. Structures of the R26rtTACreER and R26IAP knock-in alleles.
(A) The WT Rosa26 locus showing the location of the ubiquitous transcript derived from this locus and the unique Xba I site into which the rtTACreER and IAP cassettes were inserted. (B) The R26rtTACreER locus. The rtTA coding region is preceded by a splice acceptor so that it can be spliced onto the 5′ exon of the endogenous Rosa26 transcript, and it is followed by multiple transcription termination signals (“stop”). In the presence of doxycycline, the rtTA protein activates transcription from the seven head-to-tail Tet response elements immediately 5′ of a minimal cytomegalovirus immediate early promoter (“TRE”), leading to expression of the CreER coding region. The resulting CreER protein translocates to the nucleus upon binding to 4-hydroxytamoxifen (4HT). (C) The R26IAP locus in its germline configuration (upper diagram) and following Cre-mediated recombination (lower diagram). The IAP region is preceded by a splice acceptor so that it can be spliced onto the 5′ exon of the endogenous Rosa26 transcript. In the germline configuration, the two loxP sites in head-to-head orientation surround a central region that must be inverted to generate a correctly configured human placental alkaline phosphatase (hPLAP) minigene (lower diagram). In the orientation shown in the lower diagram, one loxP site resides in the intron and the second loxP site resides in the 3′ UTR. For the R26rtTACreER allele, the frt-flanked PGK-Neo selectable marker used during ES culture was removed by Flp-mediated recombination in the mouse germline. Scale bars in A, B and C are 1 Kb.
Figure 2
Figure 2. Dose and timing of doxycycline and 4HT exposure on Cre-mediated recombination efficiency using R26rtTACreER.
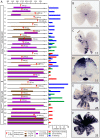
(A) Individual experiments are numbered, the doxycycline and 4HT regimens are shown schematically, and the number of mice with high/medium, sparse, or no AP+ labeling of RGCs is shown in the color-coded histograms at right. Experiments 1–21 and 22–33 were performed with R26rtTACreER;Brn3aCKOAP/+ and R26rtTACreER;Brn3bCKOAP/+ mice, respectively. (B–F) Representative retina flat mounts (B,C,E,F) and a 200 µm coronal brain section at the level of the superior colliculus (D) were obtained from the numbered experiments indicated in the lower right corner of each panel. A single IP injection was used to deliver 4HT either to the mother for in utero exposure or to individual pups for postnatal exposure.
Figure 3
Figure 3. R26IAP is a sensitive reporter for Cre-mediated recombination in individual cells.
(A–D) R26CreER;R26IAP mice either in the absence (A,B) or following intra-ocular injection (C,D) of 4HT show widespread Cre-mediated recombination in diverse cell types. A, brain; B, retina, C, lens, D, cornea. AP+ lens fiber and lens epithelial cells are seen in C. The overall frequency of AP-expressing cells in the brain and retina in the absence of 4HT is ∼0.01%. (E–G) R26IAP mice that received an IP injection of ∼184 µg of purified His-NLS-Cre protein show scattered Cre-mediated recombination only in epithelial cells lining the peritoneal cavity or in the muscle fibers of the abdominal wall immediately beneath the peritoneal surface. E, liver; F, abdominal wall; G, stomach. (H) R26IAP mice that received an intraocular injection of ∼7 µg of purified His-NLS-Cre protein at ∼P5 show scattered Cre-mediated in RGCs and in occasional astrocytes. RGC axons are converging on the optic nerve head at the top of the panel. (I,J) Retina (I) and cornea (J) following an intra-ocular injection of a replication defective adenovirus expressing Cre. Cre-mediated recombination and AP expression are confined to tissues near the injection site. In the retina, the compact appearance of the AP+ cells and the absence of AP+ axons suggests that most of the labeled cells are astrocytes and/or Muller glia. (K–O) Tissues from R26IAP mice in the absence (K) or following IV injection (L–O) of a replication defective adenovirus expressing Cre (Ad-Cre). K–N, kidney; O, liver. The boxed region of the renal pelvis in L is enlarged in M. N shows a region of renal cortex from a different mouse that received an IV injection of Ad-Cre in which Cre-mediated recombination was also observed in a subset of cortical tubules. Scale bars are: 1 mm for E and O; and 200 µm for D,F,G,H,J,M, and N.
Figure 4
Figure 4. Survey of cholinergic neuronal morphologies and projections in the brain and retina of R26IAP;ChAT-IRES-CreER mice.
Animals were injected with a single IP injection of 200 µg 4HT at P8. (A,C,F,I,K) 300 µm coronal sections at Bregma positions 1.2, 0, −2.5, −5.0, and −7.8, respectively, as shown schematically in (N). (B,D,E,G,H,J,L) enlargements of boxed regions. (M) In a flat mounted retina, AP-expression is present exclusively in starburst amacrine cells. In the absence of 4HT, retinas were devoid of AP+ cells. BNA, basolateral nucleus of the amygdala; DMN(VN), dorsal motor nucleus of the vagus nerve; LDTN, laterodorsal tegmental nucleus; MS, Medial septum; PPTN; pedunculopontine tegmental nucleus; SI, substantia innominata; St, striatum.
Figure 5
Figure 5. Survey of catecholaminergic neuronal morphologies and projections in the brain of TH-IRES-CreER;R26IAP mice.
Animals were injected with 100 µg 4HT at P3. (A–E,G,I,K,L) 300 µm coronal sections at Bregma positions 1.7, 1.1, 0, −1.6, −2.2, −3.2, −4.7, −5.5, −8.2, respectively, as shown schematically in (N). (F,H,J,M) enlargements of boxed regions. A1, A1 noradrenergic cell group; A2, A2 noradrenergic cell group; AcN, accumbens nucleus; AN, arcuate nucleus; CNA, central nucleus of the amygdala; DRN, dorsal raphe nucleus; LC, locus coeruleus; ME, median eminence; PPTN, pedunculopontine tegmental nucleus; SN(PR), substantia nigra (pars reticulata); St, striatum; VP, ventral pallidum; VTA, ventral tegmental area; ZI, zona incerta.
Figure 6
Figure 6. Morphologies of individual AP+ type 1 DA cells from the retinas of TH-IRES-CreER;R26IAP mice.
A single 100–300 µg 4HT injection was administered IP between P3 and P8; retinas were analyzed ∼6 weeks later. Retina flat mounts were processed for AP histochemistry and clarified in BBBA. Axon-like processes (green) and dendrites (blue) were traced with Neuromantic software. The soma is indicated by a red arrow. The outline of the flattened retina and the location of the optic disc are shown in red. (A) Twelve retinas, each of which had a single type 1 DA cell. (B) A retina with two type 1 DA cells. (C) Image of the boxed region of the retina shown in (B). The dendrites (lower right) are uniformly thicker and more darkly stained than the axon-like processes. (D) A putative type 2 DA cell. Scale bars in B and D, 500 µm. Scale bar in B applies to panels A and B. BBBA causes ∼30% tissue shrinkage.
Figure 7
Figure 7. Quantification of axon-like processes and dendrite lengths for type 1 DA cells.
Red circles, lengths calculated from the Neuromantic tracing of BBBA clarified retinas. BBBA causes ∼30% tissue shrinkage. Black circle and error bars, mean+/−S.D.

References

    1. Branda CS, Dymecki SM. Talking about a revolution: the impact of site-specific recombinases on genetic analysis in mice. Dev Cell. 2004;6:7–28. - PubMed
    1. Feil R, Brocard J, Mascrez B, LeMeur M, Metzger D, et al. Ligand-activated site-specific recombination in mice. Proc Natl Acad Sci USA. 1996;93:10887–10890. - PMC - PubMed
    1. Hayashi S, McMahon AP. Efficient recombination in diverse tissues by a tamoxifen-inducible form of Cre: a tool for temporally regulated gene activation/inactivation in the mouse. Dev Biol. 2002;244:305–318. - PubMed
    1. Rotolo T, Smallwood PM, Williams J, Nathans J. Genetically-directed, cell type-specific sparse labeling for the analysis of neuronal morphology. PLoS One. 2008;3:e4099. - PMC - PubMed
    1. Badea T, Nathans J. Quantitative analysis of neuronal morphologies in the mouse retina visualized using a genetically directed reporter. J Comp Neurol. 2004;480:331–351. - PubMed

Publication types

LinkOut - more resources