. 2010 Jan;196(1):23-35.
doi: 10.1007/s00359-009-0489-5. Epub 2009 Nov 19.

Photoreceptor responses of fruitflies with normal and reduced arrestin content studied by simultaneous measurements of visual pigment fluorescence and ERG

Affiliations

Photoreceptor responses of fruitflies with normal and reduced arrestin content studied by simultaneous measurements of visual pigment fluorescence and ERG

Gregor Belusic et al. J Comp Physiol A Neuroethol Sens Neural Behav Physiol. 2010 Jan.

Abstract

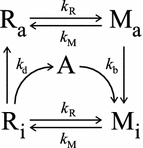
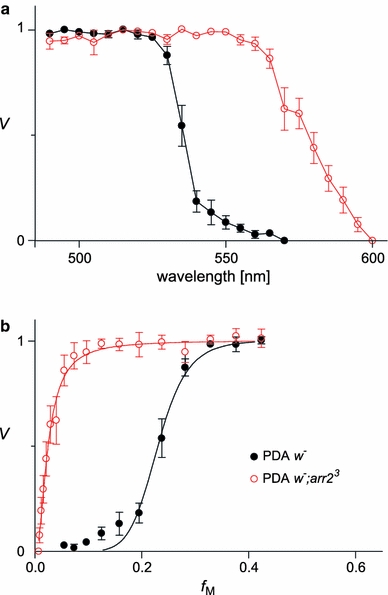
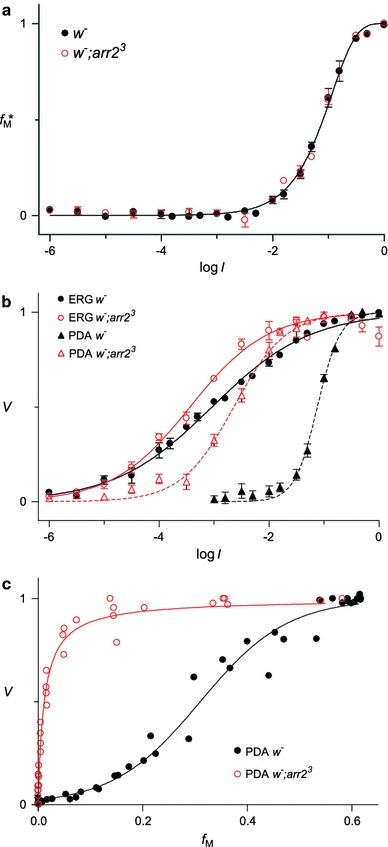
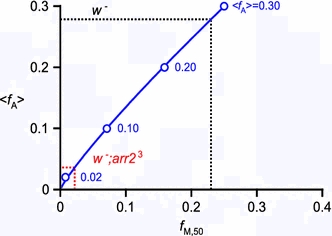
We have simultaneously measured the electroretinogram (ERG) and the metarhodopsin content via fluorescence in white-eyed, wild-type Drosophila and the arrestin2 hypomorphic mutant (w(-);arr2 (3)) at a range of stimulus wavelengths and intensities. Photoreceptor response amplitude and termination (transition between full repolarization and prolonged depolarizing afterpotential, PDA) were related to visual pigment conversions and arrestin concentration. The data were implemented in a kinetic model of the rhodopsin-arrestin cycle, allowing us to estimate the active metarhodopsin concentration as a function of effective light intensity and arrestin concentration. Arrestin reduction in the mutant modestly increased the light sensitivity and decreased the photoreceptor dynamic range. Compared to the wild type, in the mutant the transition between full repolarization and PDA occurred at a lower metarhodopsin fraction and was more abrupt. We developed a steady-state stochastic model to interpret the dependence of the PDA on effective light intensity and arrestin content and to help deduce the arrestin to rhodopsin ratio from the sensitivity and PDA data. The feasibility of different experimental methods for the estimation of arrestin content from ERG and PDA is discussed.


Figures

Fig. 1
Fig. 1
Spectral properties of the main visual pigment, Rh1, of Drosophila. a The photosensitivities (β) of the two thermostable states, rhodopsin (R) and metarhodopsin (M), normalized to the rhodopsin peak, the relaxation spectrum (sum of photosensitivities β R + β M), and the metarhodopsin fraction in the photosteady state created by monochromatic stimuli with wavelength λ. The spectra were calculated with the template functions of Govardovskii et al. (2000) using peak wavelength values 486 and 566 nm for R and M, respectively. b Time course of the metarhodopsin fraction due to irradiating a visual pigment population, where initially all molecules are in the rhodopsin state with monochromatic light (490–550 nm, 15 nm steps; left, 5 s pulse at t = 0 s), and the time course of the different reconversions due to subsequent red light of 600 nm (right, 5 s pulse at t = 8 s). The intensity of the pulses is identical and set so that the time constant of the photoconversion resembles the time constants in the experiment of Fig. 3a. Since the sum of photosensitivities β R + β M hardly changes within the wavelength range presented, the photoconversions show almost identical time courses
Fig. 2
Fig. 2
Simplified diagram of the primary light-induced visual pigment processes in Drosophila. Ra is the native, active rhodopsin, which on photoconversion yields the active metarhodopsin state, Ma; this state triggers the phototransduction chain resulting in a receptor potential. By phosphorylation and binding of arrestin, Ma is transformed into the inactive metarhodopsin state, Mi. Photoconversion of Mi results in the inactive rhodopsin state, Ri, which transforms back to the active rhodopsin state after arrestin release and dephosphorylation (Hardie and Postma 2008). The rate constants for the photoconversions are k R and k M, and those for arrestin binding and dissociation are k b and k d, respectively
Fig. 3
Fig. 3
Metarhodopsin fluorescence as a function of wavelength. a Fluorescence signals induced by a number of monochromatic light pulses (wavelengths 490–550 nm) followed by a red (600 nm) light pulse (Drosophila, w ). The values of the initial red-induced emission due to the metarhodopsin, A, and the background value, B, were measured. b The ratio ϕ of A and B as a function of the wavelength of the adapting light pulse (red symbols w ;arr2 3; black symbols w ; error bars SEM). Curves expected for f M in the photosteady state (Fig. 1a) were fitted to the data, yielding the two right-hand ordinates
Fig. 4
Fig. 4
The ERG during a stimulus sequence similar to that in Fig. 3a measured in (a) the wild type (w ) and (b) the arrestin mutant (w ;arr2 3). A number of monochromatic light pulses, indicated by their peak wavelengths, duration 5 s, were followed by 7-s darkness and a 5-s red (600 nm) pulse. Note the slow return to the dark level of the ERG in the arrestin mutant. The arrow in a marks the time point at which the afterpotentials were measured
Fig. 5
Fig. 5
The dependence of the afterpotential on adapting wavelength and metarhodopsin fraction. a The normalized afterpotential at the end of the 7-s dark period with respect to the ERG level in darkness (see Fig. 4), as a function of the adapting wavelength. b The normalized afterpotential values as a function of the created metarhodopsin fraction, derived by using Fig. 3b, fitted with Hill functions (error bars, SEM)
Fig. 6
Fig. 6
Simultaneous measurements of the metarhodopsin fluorescence (a, b) and electroretinogram (c, d) from the eyes of a wild-type Drosophila, w (a, c) and the arrestin mutant w ;arr2 3 (b, d) elicited by monochromatic blue pulses of 490 nm followed by red pulses (600 nm). Blue pulses with intensities log I > −3 created a measurable metarhodopsin fraction as witnessed by the red-induced fluorescence signal (fluorescence decay induced by the 600 nm pulse)
Fig. 7
Fig. 7
a Normalized metarhodopsin fraction, f M*, as a function of the intensity of the blue pulse. Data points (error bars, SEM) from both strains virtually coincide and are fitted with a single exponential function of the light intensity, I. The fit allows calculation of the f M in the low light intensity. b Amplitudes V of ERG responses (ERG) and afterpotentials (PDA) elicited by the blue light (490 nm) pulses of Fig. 6, for both the wild type (w ) and the arrestin mutant (w ;arr2 3); error bars, SEM. The ERG responses and PDA functions are fitted with Hill functions. c Afterpotential as a function of f M created by the graded blue pulses. The f M value was calculated from the exponential fit in a
Fig. 8
Fig. 8
The steady-state PDA transition model and comparison with experimental data. a The number of microvilli, M, as a function of the metarhodopsin surplus, ΔN, for a population of 5,000 microvilli with an average 1,000 visual pigment molecules per microvillus. The horizontal bin size is set to 1. Left histograms for an average number of arrestin molecules per microvillus 〈N A〉 = 20 and mean metarhodopsin fractions 〈f M〉 = 0.0, 0.02 and 0.04. RightN A〉 = 200 and 〈f M〉 = 0.18, 0.20 and 0.22. The area of the histograms with ΔN > 0 represents the fraction of microvilli in the PDA state. b Two-dimensional histograms of the distribution of ΔN as a function of 〈f M〉. The four streaks correspond to four cases with average arrestin content 〈N A〉 = 20, 100, 200 and 300, respectively. Microvilli with ΔN > 0 are in the PDA. Note the narrowing of the histogram at low 〈N A〉. c The PDA function P(〈f M ). Blue circles show the modeled fractions of microvilli in the PDA state as a function of 〈f M 〉. The blue lines are cumulative beta distribution function fits. At P = 0.5 (horizontal dashed line) half of the microvilli are active. d The afterpotential function V(〈f M〉) obtained by a sigmoidal transformation of P(〈f M ). The blue curves are Hill fits of V(〈f M〉). The horizontal dashed black line indicates that half of the microvilli are active at about 95% of the normalized afterpotential. The black and red curves are Hill function fits of the experimental obtained data for V(〈f M〉) in the wild type and arrestin2 mutant arr2 3, respectively. The solid and dashed curves are the ERG and PDA data taken from Figs. 5b and 7c
Fig. 9
Fig. 9
The arrestin to visual pigment ratio, 〈f A〉, as a function of the metarhodopsin fraction needed for a half-maximal afterpotential, f M,50. Values obtained from Hill function fits to the modeled afterpotential, P(〈f M〉), curves of Fig. 8d are given by open circles, together with a power function fit 〈f A〉 = (f M,50)0.87 (blue line). The vertical dashed lines are at the f M,50 values following from the experimentally obtained curves of Fig. 5b, and the horizontal dashed lines then yield the corresponding 〈f A〉-values (wild type black; arrestin2 mutant; red lines)

Similar articles

Cited by

References

    1. Byk T, Bar-Yaacov M, Doza YN, Minke B, Selinger Z. Regulatory arrestin cycle secures the fidelity and maintenance of the fly photoreceptor cell. Proc Natl Acad Sci USA. 1993;90:1907–1911. doi: 10.1073/pnas.90.5.1907. - DOI - PMC - PubMed
    1. Cosens DJ, Briscoe D. A switch phenomenon in the compound eye of the white-eyed mutant of Drosophila melanogaster. J Insect Physiol. 1972;18:627–632. doi: 10.1016/0022-1910(72)90190-4. - DOI
    1. Dartnall HJA. Photosensitivity. In: Dartnall HJA, editor. Handbook of sensory physiology, vol VII/1. Berlin: Springer; 1972. pp. 122–145.
    1. Dempster J (2001) The laboratory computer: a guide for neuroscientists and physiologists, Academic Press, New York
    1. Dolph PJ, Ranganathan R, Colley NJ, Hardy RW, Socolich M, et al. Arrestin function in inactivation of G-Protein coupled receptor rhodopsin in vivo. Science. 1993;260:1910–1916. doi: 10.1126/science.8316831. - DOI - PubMed

Publication types

MeSH terms

LinkOut - more resources