. 2009 Dec;238(12):3297-309.
doi: 10.1002/dvdy.22167.

Differential activity of Wnt/beta-catenin signaling in the embryonic mouse thalamus

Affiliations

Differential activity of Wnt/beta-catenin signaling in the embryonic mouse thalamus

Krista K Bluske et al. Dev Dyn. 2009 Dec.

Abstract

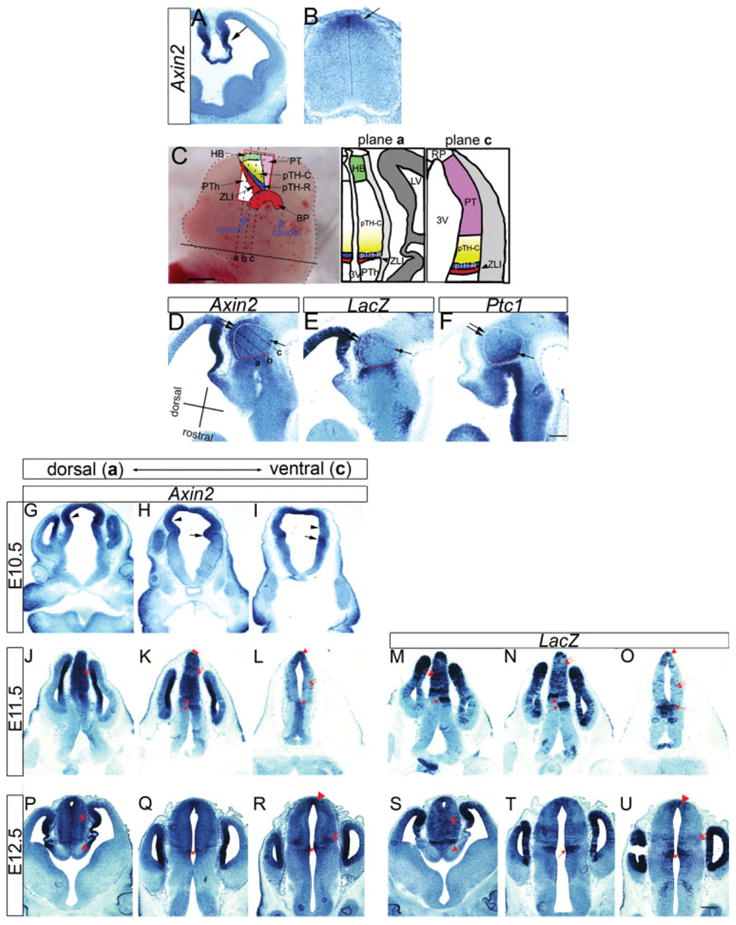
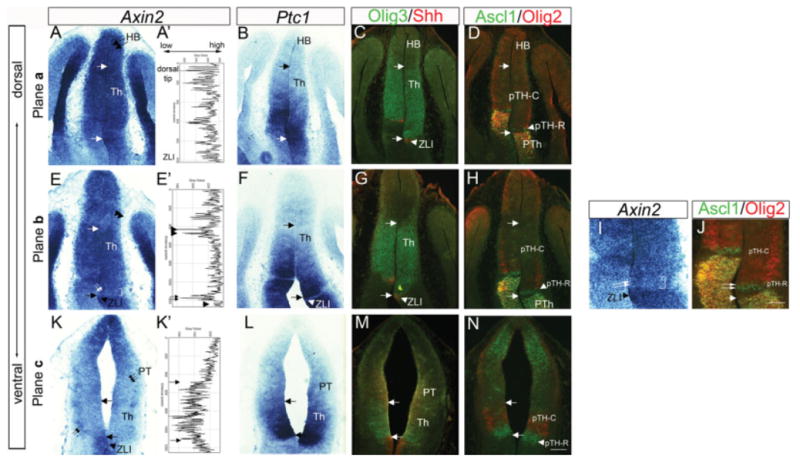
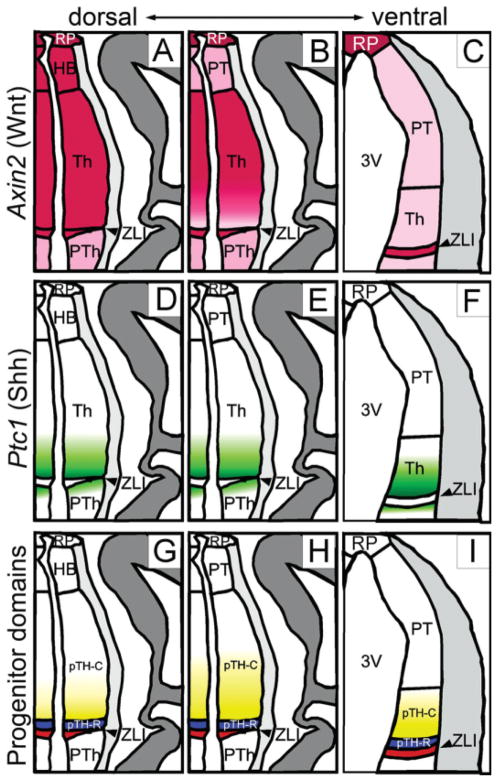
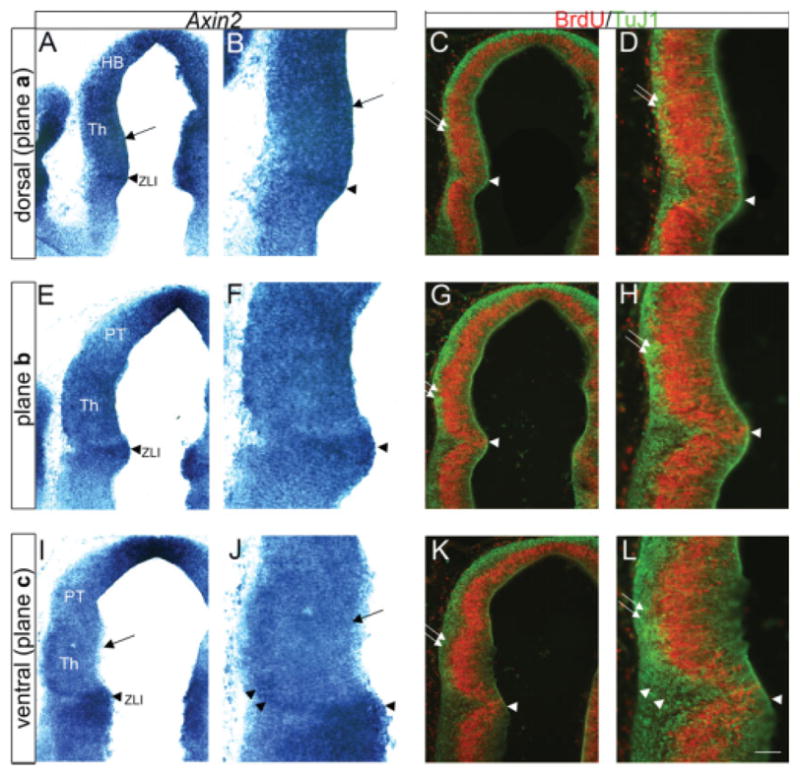
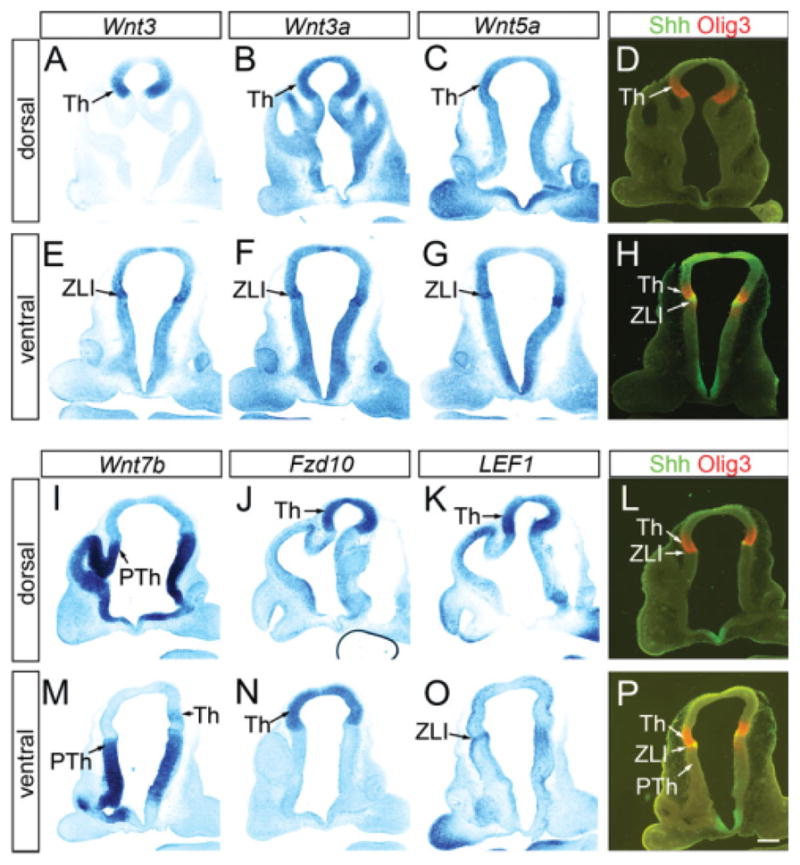
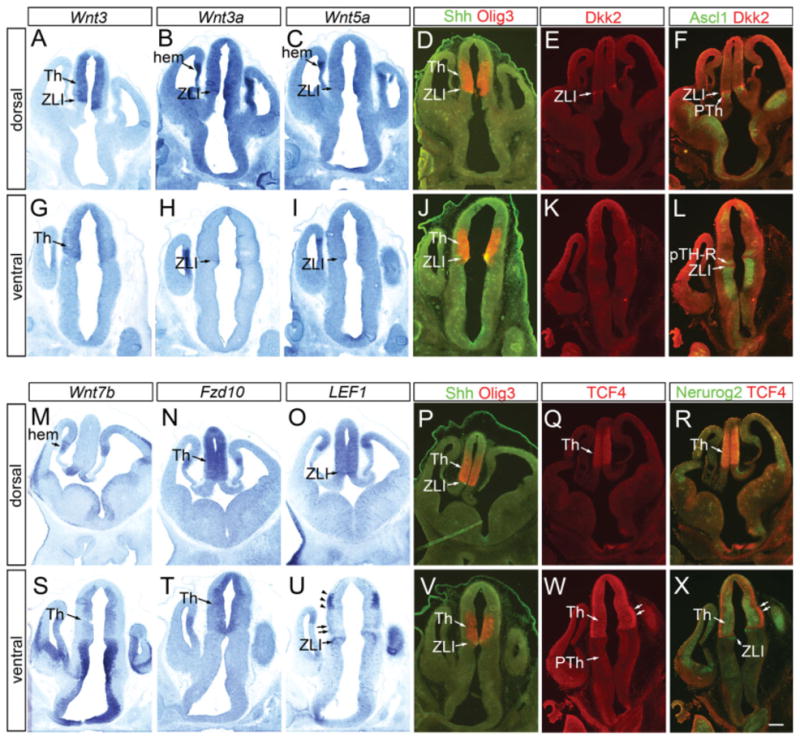
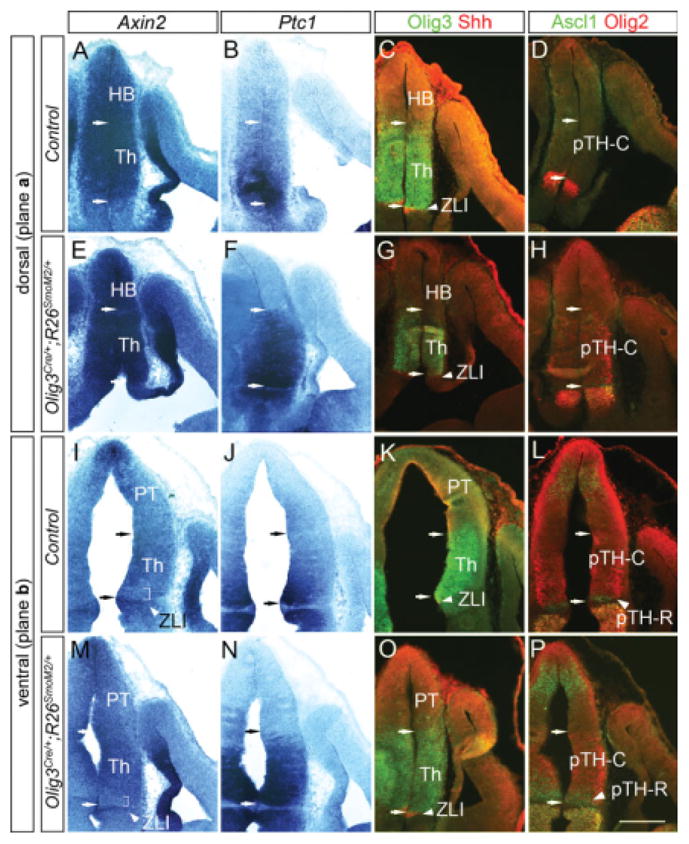
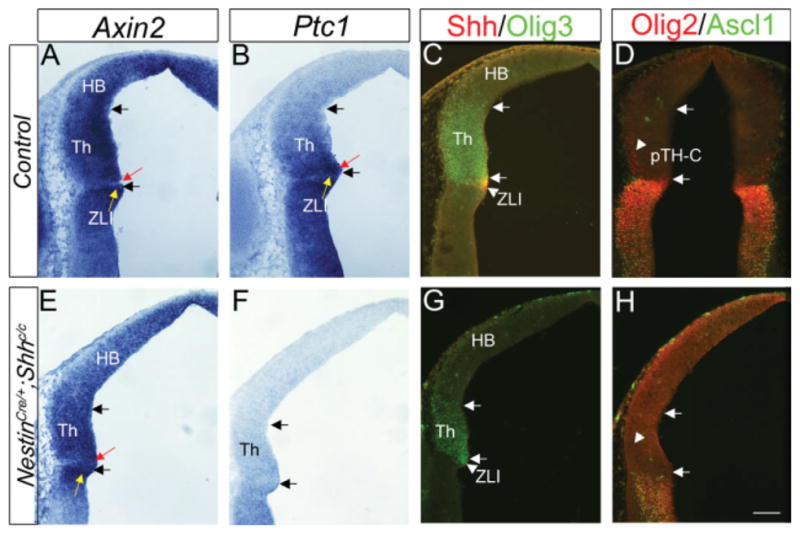
In neural development, several Wnt genes are expressed in the vertebrate diencephalon, including the thalamus. However, roles of Wnt signaling in the thalamus during neurogenesis are not well understood. We examined Wnt/beta-catenin activity in embryonic mouse thalamus and found that a Wnt target gene Axin2 and reporter activity of BAT-gal transgenic mice show similar, differential patterns within the thalamic ventricular zone, where ventral and rostral regions had lower activity than other regions. Expression of Wnt ligands and signaling components also showed complex, differential patterns. Finally, based on partially reciprocal patterns of Wnt and Shh signals in the thalamic ventricular zone, we tested if Shh signal is sufficient or necessary for the differential Axin2 expression. Analysis of mice with enhanced or reduced Shh signal showed that Axin2 expression is similar to controls. These results suggest that differential Wnt signaling may play a role in patterning the thalamus independent of Shh signaling.


Figures

Fig. 1
Fig. 1
Differential expression of Axin2 and BAT-gal in the thalamic ventricular zone. A: At embryonic day (E) 11.5, Axin2 is expressed in the medial part of the telencephalon including the cortical hem (arrow) that is known to express several Wnt ligands. B: At E11.5, Axin2 is also expressed in the dorsal spinal cord (arrow). C: Schematic representations to show axial nomenclature and section planes of frontal sections used in this study, based on our previous study (Vue et al., 2007). In the left panel, a lateral view of E12.5 mouse brain is shown. Front of the brain is to the left. As shown in blue dotted line, the rostrocaudal axis is curved in the caudal diencephalon, which includes the thalamus. Three different planes of frontal sections (a,b,c) are shown. Section plane a includes the dorsal region, and section c includes the most ventral part of the thalamus. The thalamic ventricular zone is divided into the rostroventral domain pTH-R (blue) and the caudodorsal domain pTH-C (yellow). There is a graded expression transcription factors such Olig2 and Dbx1 within pTH-C. The gradient of Olig2 expression is represented by the intensity of the yellow color. The thalamus is bordered rostrally by the zona limitans intrathalamica (ZLI, red) and ventrally by the basal plate (BP, red). The prethalamus is located rostral to the ZLI. The habenula (HB, green) is dorsal to the thalamus and the pretectum (PT, pink) is caudal to the thalamus. D–F: Three adjacent sagittal sections from BAT-gal embryos showing differential expression of Axin2 (D), LacZ (E), and Ptc1 (F) in the thalamus. Rostrocaudal and dorsoventral axes within the thalamus are shown. a, b, and c show three hypothetical section planes that correspond to C. The thalamus (indicated by Olig3 expression in adjacent sections) is outlined by dotted white lines, where the red segment is the rostral boundary of the thalamus abutting the ZLI. In D and E, the dorsal region of the thalamus shows strong Axin2 and LacZ expression (double arrows), whereas the ventral part has a weaker signal (arrow). In F, Ptc1 is expressed in a smooth gradient within the thalamus, where the rostroventral region (arrow) shows stronger expression than the dorsocaudal region (double arrows). G–U: Frontal sections showing Axin2 expression in the diencephalon of E10.5 (G–I), and Axin2 and LacZ expression in E11.5 (J–O) and E12.5 (P–U) mouse embryos. G, J, M, P, and S are sections that include the dorsal region of the thalamus (corresponding to plane a in C) and I, L, O, R, and U include the most ventral part, corresponding to plane c. G–I: At E10.5, Axin2 is expressed in the ZLI (H and I, arrows) and in the thalamic ventricular zone (G, H, I, arrowheads), with higher expression in the thalamus of dorsal sections (G) than ventral sections (I). J–O: At E11.5, Axin2 and LacZ are expressed in the ZLI (K, L, M, N, O, arrows) and in a heterogeneous pattern within the thalamus (J–O). J,M: Dorsal sections have strong expression throughout the thalamic ventricular zone (double arrows). K,N: More ventrally, expression is heterogeneous, with most of the caudal diencephalon high except for two regions that show low signal: a region adjacent to the ZLI (arrowheads) and in the pretectum (double arrows). L,O: The ventral-most sections show very low Axin2 and LacZ expression throughout the thalamus and pretectum (double arrows). P–U: At E12.5, Axin2 and LacZ are expressed highly in the thalamus of dorsal sections (P,S, double arrows), in the ZLI (Q,R,T,U, arrows), and in a ventral lateral population (R,U, double arrows). Scale bars = 1 mm for the left panel of C, 200 μm in A,B,D–U.
Fig. 2
Fig. 2
Comparison of Axin2 expression with Ptc1 and markers of different progenitor populations in the thalamus. Frontal sections of E11.5 embryos are shown. A–D,K–N: Sections of the dorsal part of the thalamus (A–D) the most ventral part of the thalamus (K–N). E–J: Sections between A–D and K–N. Within each set of panels, adjacent sections were analyzed for in situ hybridization (Axin2, Ptc1) and double immunohistochemistry (Olig3 and Shh, Ascl1 and Olig2). C,D,G,H,J,M,N: Arrows in each panel indicate the boundaries of thalamic ventricular zone as delineated by Olig3 and Shh expression. Ascl1 is expressed in the rostroventral progenitor domain, pTH-R as well as in the prethalamus (PTh), and Olig2 is expressed in the rostral and ventral part of pTH-C and the prethalamus. A: Dorsal sections show homogeneous, high Axin2 expression (A). E: More ventral sections have heterogeneous Axin2 expression, with low expression adjacent to the ZLI (double arrows) and in the pretectum (double arrowheads) and high expression in remainder of the thalamic ventricular zone. I is a higher magnification image of E and shows the region adjacent to the ZLI (I, double arrows and bracket) with reference to Ascl1 (J, double arrows) and Olig2. K: Most ventrally, Axin2 is low throughout the thalamus and pretectum (triple arrows), with the exception of a lateral population that expresses Axin2 (double arrows). Pixel intensity of Axin2 in situ images shown in panels A′, E′, and K′ were obtained from the images in A, E, and K, respectively. High pixel values are to the right and low values to the left; the top of the graph corresponds to values for the dorsal tip of the diencephalon and the bottom corresponds to the ZLI. The habenula (HB) is on top of the thalamus in sections A–D and the pretectum (PT) is on top of the thalamus in sections K–N. HB, habenula; Th, thalamus; ZLI, zona limitans intrathalamica. Scale bar = 100 μm.
Fig. 3
Fig. 3
Schematic summary of Axin2 expression in relation to Shh activity and thalamic progenitor domains. Midline is to the left. A–C: Axin2 expression shown in pink. A: On dorsal sections, Axin2 is uniformly high in the thalamus as well as the ZLI, habenula (HB) and the roof plate (RP). The prethalamus (PTh) shows lower expression, which is shown in lighter pink. B: At the middle level, Axin2 expression is strong in the roof plate, the caudal part of the thalamus and the ZLI. C: The pretectum (PT), the rostral part of the thalamus just caudal to the ZLI and the prethalamus show weaker expression. At the most ventral level, Axin2 is strong only in the roof plate and the ZLI, whereas other part is uniformly weak. Not shown here is that the lateral edge of the thalamic ventricular zone shows strong Axin2 expression even at this ventral level (Fig. 3I, double arrowheads). D–F: Ptc1 expression shown in green to indicate the differential Shh signaling. On all three section planes, Ptc1 shows a rostral-high, caudal-low gradient of expression, whereas the ZLI does not express Ptc1. Ptc1 is also expressed in the most caudal part of the prethalamus. G–I: Thalamic progenitor domains. The thalamic ventricular zone, which lies caudal to the ZLI (red), is divided into two domains, pTH-R (blue) and pTH-C (yellow-white). pTH-R expresses transcription factors such as Ascl1 and Nkx2.2, whereas pTH-C expresses Neurog2 (=Neurogenin 2 or Ngn2), Olig2, and Dbx1. Olig2 is expressed in rostroventral-high, caudodorsal-low pattern (shown in the graded yellow color) and Dbx1 is expressed in the opposite pattern within pTH-C.
Fig. 4
Fig. 4
Comparison of Axin2 expression with markers for cell proliferation and neuronal differentiation. Frontal sections through embryonic day (E) 11.5 embryos are shown. Midline is to the right. A–D include the dorsal-most part of the thalamus and corresponds to section plane a of Figure 1C; E–H corresponds to section plane b; and I–L includes the ventral-most part of the thalamus and corresponds to section plane c. Within each set of panels, adjacent sections were analyzed for in situ hybridization (Axin2) and double immunohistochemistry (bromodeoxyuridine [BrdU] and TuJ1). B, D, F, H, J, and L are higher power images of those shown in A, C, E, G, I, and K, respectively. Bromodeoxyuridine (BrdU) was injected into pregnant females 30 min before killing. BrdU is incorporated during S-phase of the cell cycle and is used as a marker of proliferating cells. TuJ1 labels newly generated neurons. Arrowheads in all panels label the position of the ZLI. The thickness of the TuJ1-positive mantle layer is used as a measure of cumulative neurogenesis (double arrows in C,D,G,H,K,L). The thickness of the TuJ1-positive layer is larger ventrally (K and L) than dorsally (C,D). Axin2 expression is high dorsally and low ventrally (A,B compared with I,J, arrows). An Axin2-positive lateral population is likely TuJ1-positive (J and L, arrowheads). HB, habenula; PT, pretectum; TH, thalamus; ZLI, zona limitans intrathalamica. Scale bar = 100μm.
Fig. 5
Fig. 5
Differential expression of Wnt ligands and signaling components in thalamic progenitor cells at embryonic day (E) 10.5. Frontal sections of E10.5 forebrain. A–P: A–D and I–L are sections that include dorsal part of the thalamus, whereas sections E–H and M–P contain more ventral part. A–P: In situ hybridization for Wnt3 (A,E), Wnt3a (B,F), Wnt5a (C,G), Wnt7b (I,M), Fzd10 (J,N), and LEF1 (K,O) are shown in comparison with double immunohistochemistry of Olig3 and Shh (D,H,L,P) that provides reference for the thalamic ventricular zone. See text for more details. Th, thalamus; ZLI, zona limitans intrathalamica; PTh, prethalamus. Scale bar = 200 μm.
Fig. 6
Fig. 6
Differential expression of Wnt ligands and signaling components in thalamic progenitor cells at embryonic day (E) 11.5. Frontal sections E11.5 forebrain. A–X: A–F and M–R are sections that include dorsal part of the thalamus, whereas sections G–L and S–X contain more ventral part. A–D,G–J,M–P,S–V: In situ hybridization for Wnt3 (A,G), Wnt3a (B,H), Wnt5a (C,I), Wnt7b (M,S), Fzd10 (N,T), and LEF1 (O,U) are shown in comparison with double immunohistochemistry of Olig3 and Shh (D,J,P,V) that provides reference for the thalamic ventricular zone. E,F,K,L,Q,R,W,X: Also shown are immunohistochemistry for Dkk2 (E,K,F,L) and TCF4 (Q,R,W,X) in combination with Ascl1 (F,L) and Neurog2 (R,X). See text for more details. Th, thalamus; ZLI, zona limitans intrathalamica; PTh, prethalamus. Scale bar = 200 μm.
Fig. 7
Fig. 7
Expression of Axin2 in Olig3Cre/+; R26SmoM2/+ mice. Frontal sections of embryonic day (E) 11.5 embryos are shown. Midline is to the left. A–P: E–H and M–P are from Olig3Cre/+; R26SmoM2/+ embryos and A–D and I–L are controls (Olig3+/+; R26SmoM2/+). A–H are sections of the dorsal part of the thalamus, and I–P contain more ventral part of the thalamus. Within each set of panels, adjacent sections were analyzed for in situ hybridization (Axin2, Ptc1) and double immunohistochemistry (Olig3 and Shh, Ascl1 and Olig2). C,G,K,O: Arrows in each panel indicate the boundaries of thalamic ventricular zone as delineated by Olig3 and Shh expression. A,B,D–F,H,L,P: In dorsal sections, Axin2 is still expressed highly throughout the thalamic ventricular zone of Olig3Cre/+; R26SmoM2/+ embryos (A,E), although Ptc1 expression is enhanced specifically in thalamic progenitor cells (F compared with B) and Ascl1 and Olig2 expression is expanded (H and P compared with D and L, respectively). I,J,M,N: More ventrally, the heterogeneous Axin2 expression pattern is retained within the thalamus (I,M), despite high Ptc1 expression (J,N). I,M: Brackets indicate a region in the rostroventral part of the thalamus with low Axin2 expression. HB, habenula; Th, thalamus; ZLI, zona limitans intrathalamica; PTh, prethalamus. Scale bar = 200 μm.
Fig. 8
Fig. 8
Expression of Axin2 in NestinCre/+; Shhc/c mice. Frontal sections of embryonic day (E) 11.0 embryos at the mid-level (close to section plane b in Fig. 1C) are shown. Midline is to the right. A–H: E–H are from NestinCre/+; Shhc/c embryos and A–D are controls (Nestin+/+; Shhc/c). Within each set of panels, adjacent sections were analyzed for in situ hybridization (Axin2, Ptc1) and double immunohistochemistry (Olig3 and Shh, Ascl1 and Olig2). Arrows in each panel indicate the boundaries of thalamic ventricular zone as delineated by Olig3 and Shh expression (C,G). B,C,F,G: Shh and Ptc1 expression were used to confirm that NestinCre/+; Shhc/c embryos have decreased Shh signaling compared with controls (F,G compared with B,C). H: The pTH-R marker Ascl1 and rostroventral pTH-C marker Olig2 are not expressed in the thalamus of NestinCre/+; Shhc/c embryos. A: In control embryos, Axin2 is highly expressed in most of the thalamus at this dorsoventral level, except in the most rostral region (shown by red arrow) immediately caudal to the ZLI (yellow arrow). E: In NestinCre/+; Shhc/c embryos, Axin2 expression is still high in most of the thalamus at this level, and low in the most rostral region (red arrow), whereas the region rostral to this weak region is again strong (yellow arrow). HB, habenula; Th, thalamus; ZLI, zona limitans intrathalamica. Scale bar = 100 μm.

References

    1. Alvarez-Medina R, Cayuso J, Okubo T, Takada S, Marti E. Wnt canonical pathway restricts graded Shh/Gli patterning activity through the regulation of Gli3 expression. Development. 2008;135:237–247. - PubMed
    1. Alvarez-Medina R, Le Dreau G, Ros M, Marti E. Hedgehog activation is required upstream of Wnt signaling to control neural progenitor proliferation. Development. 2009;136:3301–3309. - PubMed
    1. Baek JH, Hatakeyama J, Sakamoto S, Ohtsuka T, Kageyama R. Persistent and high levels of Hes1 expression regulate boundary formation in the developing central nervous system. Development. 2006;133:2467–2476. - PubMed
    1. Barolo S. Transgenic Wnt/TCF pathway reporters: all you need is Lef? Oncogene. 2006;25:7505–7511. - PubMed
    1. Bonner J, Gribble SL, Veien ES, Nikolaus OB, Weidinger G, Dorsky RI. Proliferation and patterning are mediated independently in the dorsal spinal cord downstream of canonical Wnt signaling. Dev Biol. 2008;313:398–407. - PMC - PubMed

Publication types

MeSH terms

LinkOut - more resources