. 2009 Nov 19:2:35.
doi: 10.1186/1756-6606-2-35.

Abnormalities in brain structure and behavior in GSK-3alpha mutant mice

Affiliations

Abnormalities in brain structure and behavior in GSK-3alpha mutant mice

Oksana Kaidanovich-Beilin et al. Mol Brain. .

Abstract

Background: Glycogen synthase kinase-3 (GSK-3) is a widely expressed and highly conserved serine/threonine protein kinase encoded by two genes that generate two related proteins: GSK-3alpha and GSK-3beta. Mice lacking a functional GSK-3alpha gene were engineered in our laboratory; they are viable and display insulin sensitivity. In this study, we have characterized brain functions of GSK-3alpha KO mice by using a well-established battery of behavioral tests together with neurochemical and neuroanatomical analysis.

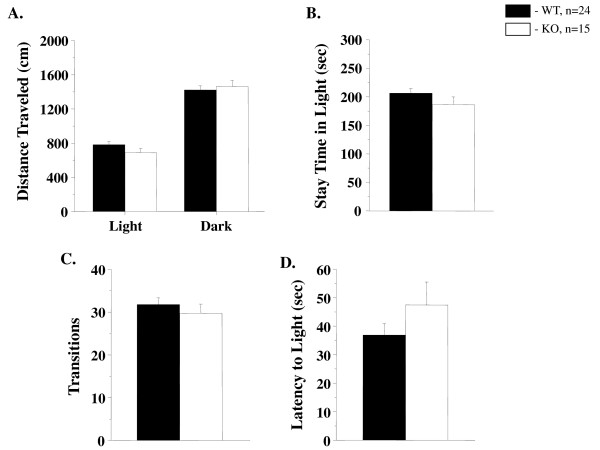
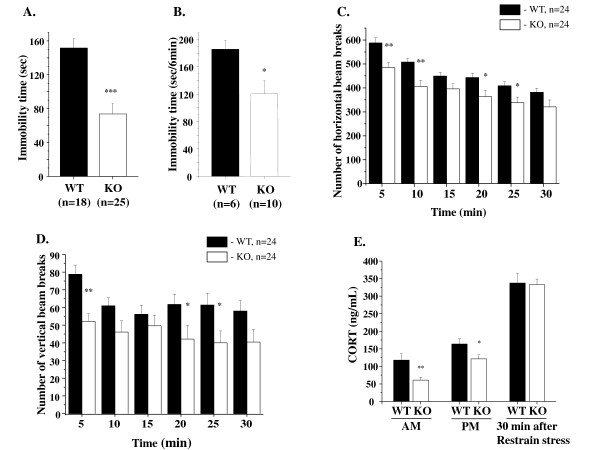
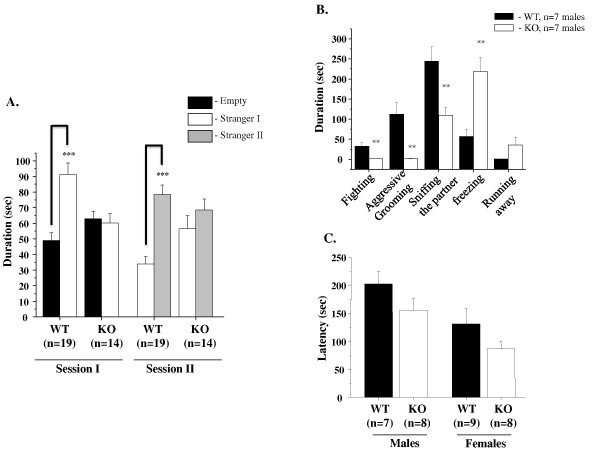
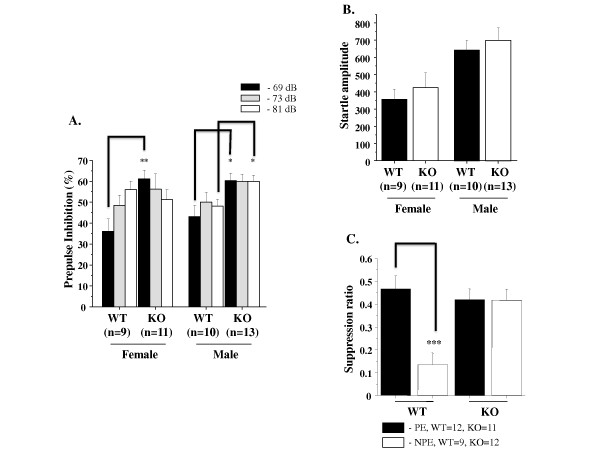
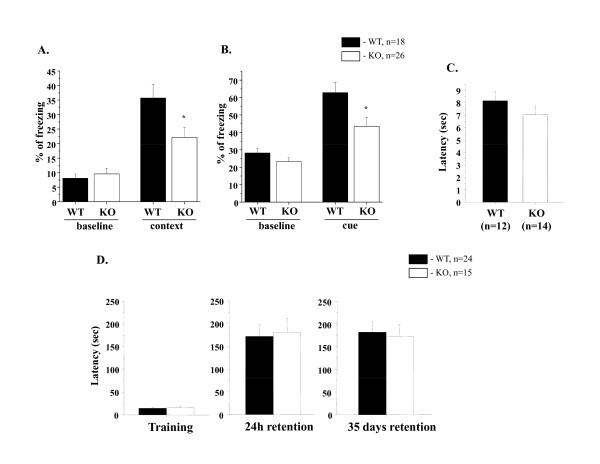
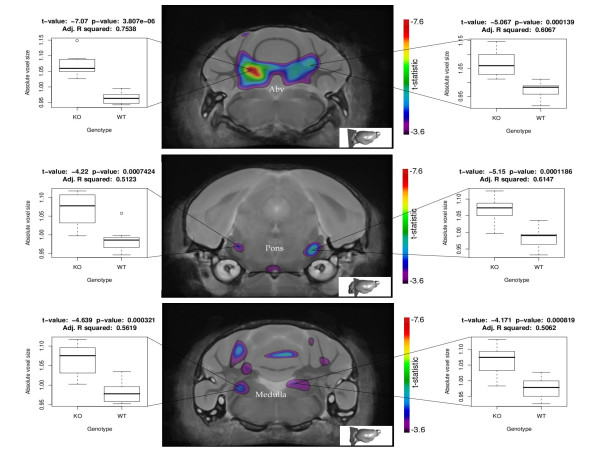
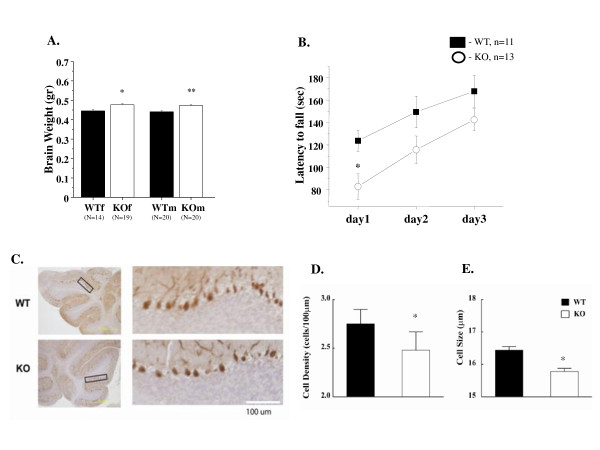
Results: Similar to the previously described behaviours of GSK-3beta(+/-) mice, GSK-3alpha mutants display decreased exploratory activity, decreased immobility time and reduced aggressive behavior. However, genetic inactivation of the GSK-3alpha gene was associated with: decreased locomotion and impaired motor coordination, increased grooming activity, loss of social motivation and novelty; enhanced sensorimotor gating and impaired associated memory and coordination. GSK-3alpha KO mice exhibited a deficit in fear conditioning, however memory formation as assessed by a passive avoidance test was normal, suggesting that the animals are sensitized for active avoidance of a highly aversive stimulus in the fear-conditioning paradigm. Changes in cerebellar structure and function were observed in mutant mice along with a significant decrease of the number and size of Purkinje cells.

Conclusion: Taken together, these data support a role for the GSK-3alpha gene in CNS functioning and possible involvement in the development of psychiatric disorders.


Figures

Figure 1
Figure 1
GSK-3α male KO mice display no differences in light/dark transition tests. In the light/dark transition test, GSK-3α KO (n = 15) and WT (n = 24) males were placed individually in the dark compartment at the start of the test. Data are given as mean (± SEM). A. Distance traveled (cm) in the light and dark sides. B. Time (sec) the mice stayed in the light side. C. Number of transitions between the light and dark sides. D. Latency time (sec) before the first entry into the light side. p.value ≥ 0.12 (n.s.)
Figure 2
Figure 2
Altered responses of GSK-3α KO mice in forced swim and tail suspension tests. A. Forced swim test. Mean duration of immobility (± SEM) of GSK-3α KO (n = 25) and WT (n = 18) mice (both genders). Immobility time was decreased in KO group ***p ≤ 0.0001 vs. WT. B. Tail suspension test. Mean duration of immobility (± SEM) of GSK-3α KO (n = 10) and WT (n = 6) mice (both genders). Immobility time was decreased in KO group *p ≤ 0.05 vs. WT. C-D. Novelty-induced locomotion and exploratory activity in the open field. Mean number of beam breaks (± SEM) in 5 min bins by GSK-3α KO (n = 24) and WT (n = 24) mice (both genders). C. Horizontal locomotion was decreased in GSK-3α KO at following time points: 0-5, 5-10, 15-20, 20-25. D. Vertical (exploratory) activity was decreased in GSK-3α KO at following time points: 0-5, 15-20, 20-25. *p ≤ 0.05; **p ≤ 0.001. E. Basal and stress-induced corticosteroid levels. Basal morning (AM) and evening (PM) levels of corticosteroid (CORT) was measured at 9.00 am and 6.00 pm respectively in the naïve mice. Two weeks after, KO (n = 10-12) and WT (n = 19-20) animals were subjected to 30 minutes of restrain stress and blood samples were collected and analyzed for the level of CORT. Values are mean (± SEM). *p ≤ 0.05; **p ≤ 0.001
Figure 3
Figure 3
Decreased social interaction and aggression in GSK-3α KO mice. A. Social affiliation and social novelty. Session I. Measurement of sociability. Mean length of time (± SEM) in the chamber with the stranger ("stranger side") than in the opposite chamber ("empty side"). Unlike WT males (n = 19), KO (n = 14) animals failed to demonstrate a preference for social proximity by spending same time in both chambers. ***p ≤ 0.0001 in WT group. Session II. Measurement of social novelty. Mean duration of time (± SEM) in the chamber with the unfamiliar mouse from the sociability phase ("stranger 1") and in the opposite chamber with a new unfamiliar mouse ("stranger 2"). Unlike WT males (n = 19), KO (n = 14) animals failed to demonstrate a preference for social novelty by spending same time in both chambers. ***p ≤ 0.0001 in WT group. B. Resident Intruder. GSK-3α KO mice (n = 7) and their littermate controls (n = 7) were individually isolated for four weeks and after were tested in the presence of the "intruder" in the home cage. GSK-3α KO males showed a significant decrease in the duration of fighting and aggressive grooming. The KO group showed decreased social interaction including the time spent sniffing the partner compared with WT males. The time spent by KO males in freezing behaviors and running away from the opponent was increased vs. WT. Values are mean (± SEM). **p ≤ 0.001. C. Olfactory bulb test. First, mice were habituated to a new chocolate food in the home cage overnight. The next day, rodent food pellets were removed from the cage, and the mice were food deprived for 24 hours. KO (n = 8) or WT (n = 7-9) mice were placed in the new cage, and the latency to find the hidden food was recorded. Values are mean (± SEM). p.value = n.s.
Figure 4
Figure 4
Impaired information processing in GSK-3α KO mice. A-B. Prepulse inhibition of acoustic startle response. A. PPI assay using a combination of startle (120 dB) and three prepulse levels (69 dB, 73 dB, and 81 dB) in GSK-3α KO (n = 11-13), WT (n = 9-10) (each gender). PPI is expressed as the mean percent reduction (± SEM) in startle amplitude at all three prepulses. Higher y axis values represent greater percent PPI. *p ≤ 0.05; **p ≤ 0.001. B. The amplitude of the acoustic startle response was similar between WT and KO. p.value = n.s. C. Latent inhibition. Mean suppression ratios (± SEM) of GSK-3α KO (n = 11-12) and WT (n = 9-12) (both genders). LI deficit was observed in GSK-3α KO group. PE = pre-exposed mice; NPE = non-pre-exposed mice to the CS. ***p ≤ 0.0001 in WT PE vs. NPE.
Figure 5
Figure 5
Long-term memory function in GSK-3α KO mice. A-B. Pavlovian fear conditioning (FC). Memory consolidation was assessed with a contextual and cued fear conditioning test. KO (n = 26) and WT (n = 18) mice were places in novel environment chamber for 3 min (conditioning stimulus, CS), where they received one electrical foot shock (unconditioning stimulus, US; shock intensity = 0.5 mV, duration = 2 sec). Twenty-four hours later mice were placed in the same (context) or modified (cue) chamber, and freezing time was measured as an indicator of memory consolidation. A. Contextual FC (baseline is a % of freezing before CS-US). B. Cued FC (baseline is a % of freezing before CS). KO mice (both genders) demonstrated less freezing in A. and B., indicating impaired contextual and cued FC. *p ≤ 0.05 in KO vs WT. C. Tail flick test. The index of antinociception was detected by hot tail-flick method in WT (n = 12) and KO (n = 14) mice. Values represent the mean time for tail flicking response following direct heat stimulation. No significant differences (p.v. = n.s) were found between the groups. D. Passive avoidance. GSK-3α KO (n = 14) and WT (n = 24) mice were tested for learned fear response to the shocked chamber. Mean latency (± SEM) scores entering into the dark chamber before electric shock; and 1 and 35 days after the electric shock are shown. No significantly differences were found between KO and WT groups (p.value = n.s).
Figure 6
Figure 6
MRI of the brain. The per-voxel results of the statistical map of the Jacobian determinant (tissue compression/expansion) are shown as composite images of two coronal sections of the GSK-3α KO brain compared to WT control brain. All colored voxels are significant with a false discovery rate of 10% (n = 9 for knock outs, n = 8 for wild types). The coronal level of each section is pictorially illustrated in the bottom right corner. Abv, arbor vita of the cerebellum, CbCx, cellebellar cortex, CrAq, cerebral aqueduct.
Figure 7
Figure 7
Neuroanatomical and histological examination of the brain. A. Brain weight. Brain weight analysis was perform in 24 weeks GSK-3α KO (n = 19-10) and WT (n = 14-10) animals. Values are mean (± SEM). *p ≤ 0.05; **p ≤ 0.001. B. Rotarod. GSK-3α KO (n = 13) and WT (n = 11) mice were tested on an accelerating rotarod in 3-day trials. Significant differences between the groups (p.value = 0.013) were found on day1 in the balance and coordination; however no changes were found in motor learning. C-D. Decrease in Purkinje cell density and size in GSK-3α KO mice. C. Purkinje cells image. Immunohistochemistry against Calbindin antibody of WT and GSK-3α KO cerebellum (shown original magnification, ×4 (upper panel) and ×10 (lower panel)). D. Statistical analysis of Purkinje cell density. Average cell density was determined by taking the ratio of the number of Purkinje cells to the length of cerebellar cortex segments. Cell density is significantly decreased in the GSK-3α KO (p < 0.05; Kolmogorov-Smirnov Z Test). E. Significant decrease of cell size in the GSK-3α KO (p < 0.01; Kolmogorov-Smirnov Z Test). Cell size was determined by measuring the longest axis of Purkinje cell bodies [N = 2345 WT, N = 1588 GSK-3α KO (number of cells)].

Similar articles

Cited by

References

    1. Embi N, Rylatt DB, Cohen P. Glycogen synthase kinase-3 from rabbit skeletal muscle. Separation from cyclic-AMP-dependent protein kinase and phosphorylase kinase. Eur J Biochem. 1980;107(2):519–527. - PubMed
    1. Woodgett JR, Cohen P. Multisite phosphorylation of glycogen synthase. Molecular basis for the substrate specificity of glycogen synthase kinase-3 and casein kinase-II (glycogen synthase kinase-5) Biochim Biophys Acta. 1984;788(3):339–347. - PubMed
    1. Woodgett JR. Molecular cloning and expression of glycogen synthase kinase-3/factor A. Embo J. 1990;9(8):2431–2438. - PMC - PubMed
    1. Ferrer I, Barrachina M, Puig B. Glycogen synthase kinase-3 is associated with neuronal and glial hyperphosphorylated tau deposits in Alzheimer's disease, Pick's disease, progressive supranuclear palsy and corticobasal degeneration. Acta Neuropathol. 2002;104(6):583–591. - PubMed
    1. Frame S, Cohen P. GSK3 takes centre stage more than 20 years after its discovery. Biochem J. 2001;359(Pt 1):1–16. doi: 10.1042/0264-6021:3590001. - DOI - PMC - PubMed

Publication types

MeSH terms

Substances