. 2010 Feb 15;186(2):155-64.
doi: 10.1016/j.jneumeth.2009.11.011. Epub 2009 Nov 17.

A combined method of laser capture microdissection and X-Gal histology to analyze gene expression in c-Fos-specific neurons

Affiliations

A combined method of laser capture microdissection and X-Gal histology to analyze gene expression in c-Fos-specific neurons

Bumsup Kwon et al. J Neurosci Methods. .

Abstract

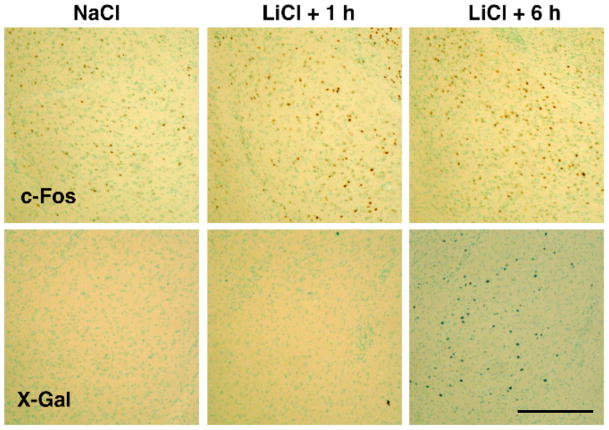
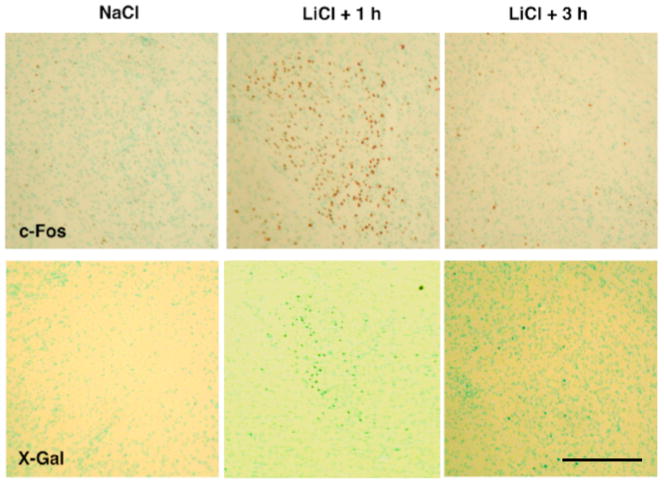
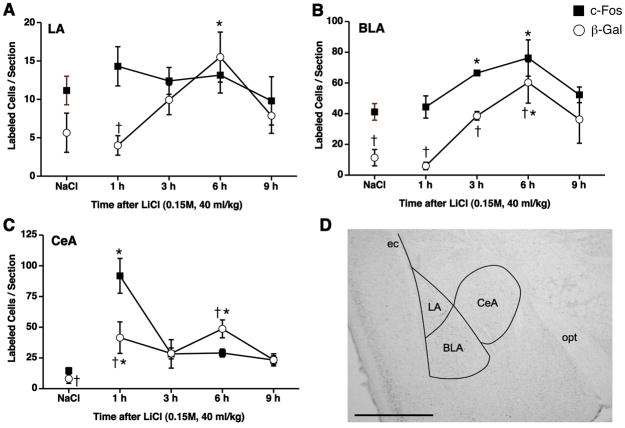
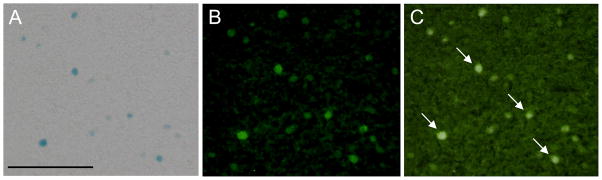
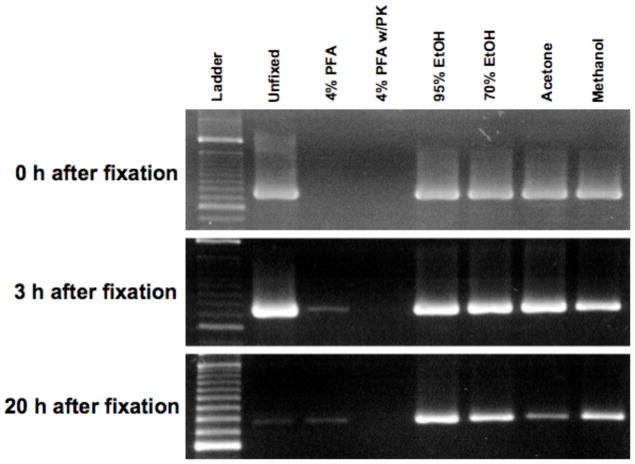
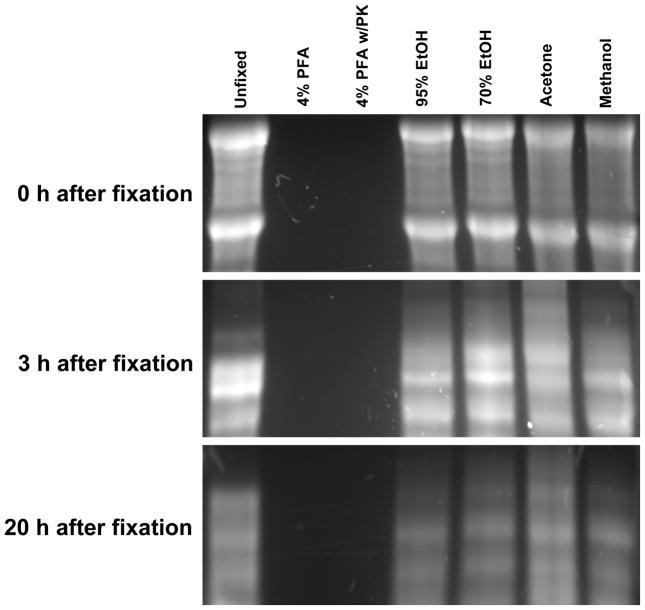
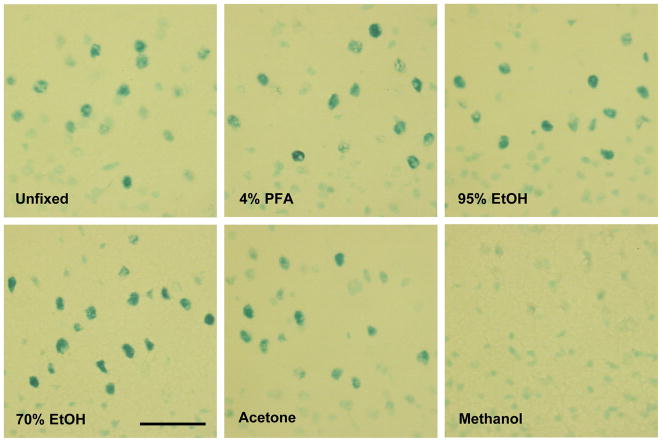
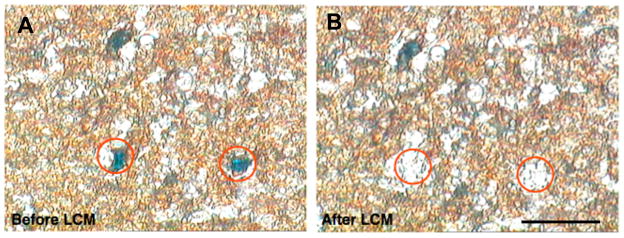
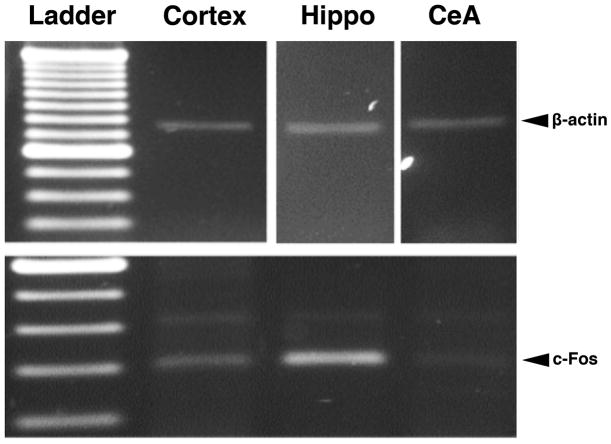
c-Fos is a member of the activator protein 1 family that regulates transcription of target genes. c-Fos is transiently induced in specific regions of the brain after a variety of external stimuli including learning and memory formation. Analysis of gene expression in c-Fos-expressing cells of the brain may help identify target genes that play important roles in synaptic strength or neuronal morphology. In the present study, we developed a combined method of laser capture microdissection and 5-bromo-4-chloro-3-indoly-beta-D-galactopyranosidase (X-Gal) histology to analyze gene expression in stimulus-induced c-Fos-positive cells. Using transgenic mice carrying a c-fos-lacZ fusion gene, c-Fos-positive cells were easily identified by measuring of beta-galactosidase (beta-Gal) activity. To establish the fidelity of the reporter transgene, the time course of endogenous c-Fos and the c-fos-lacZ transgene expression in the amygdala induced by LiCl administration was investigated by immunohistochemistry and X-Gal staining. LiCl increased the numbers of c-Fos- and beta-Gal-positive cells in the central and basolateral amygdala of the transgenic mice. To ensure that RNA was preserved in X-Gal stained tissue sections, different fixations were examined, with the conclusion that ethanol fixation was best for both RNA preservation and X-Gal staining quality. Finally, in combining X-Gal staining, single-cell LCM and RT-PCR, we confirmed mRNA expression of endogenous c-fos and beta-actin genes in LiCl-induced beta-Gal-positive cells in the CeA, cortex and hippocampus. Combining LCM and transgenic reporter genes provides a powerful tool with which to investigate tissue- or cell-specific gene expression.


Figures

Figure 1
Figure 1
Photomicrographs of c-Fos immunohistochemistry (top panels) and X-Gal staining (bottom panels) in the BLA 1 and 6 h following LiCl (i.p., 0.15 M, 40 ml/kg) or 1 h following NaCl administration. Scale bar, 300 μm.
Figure 2
Figure 2
Photomicrographs of c-Fos immunohistochemistry (top panels) and X-Gal staining (bottom panels) in the CeA 1 and 3 h following LiCl (i.p., 0.15 M, 40 ml/kg) or 1 h following NaCl administration. Scale bar, 300 μm.
Figure 3
Figure 3
Quantification of c-Fos- and β-Gal-positive cells in the LA (A), BLA (B) and CeA (C) 1, 3, 6 and 9 h following LiCl (i.p., 0.15 M, 40 ml/kg) and 1 h following NaCl administrations. LiCl increased c-Fos-positive cells in the CeA at 1 h and BLA at 3 and 6 h. LiCl also increased β-Gal-positive cells in the CeA at 1 and 6 h and BLA and LA at 6 h. β-Gal-positive cells were lower than c-Fos-positive cells in the CeA at 1 h and BLA at 6 h. * p <0.05 vs. NaCl, † p < 0.05 vs. c-Fos. n = 4 per group. A representative coronal section of the mouse brain showing outlines within which c-Fos- and β-Gal-positive cells were quantified (D). BLA, basolateral amygdala; CeA, central amygdala; ec, external capsule; LA, lateral amygdala; opt, optic tract. Scale bar in (D), 1 mm.
Figure 4
Figure 4
Photomicrographs of β-Gal-positive (blue, A) and fluorescently-labeled c-Fos-positive (green, B) cells and a merged image (C) in the CeA 1 h after a LiCl injection. Arrows in (C) indicate β-Gal and c-Fos double-labeled cells. Scale bar, 100 μm in (A).
Figure 5
Figure 5
RT-PCR products of β-actin after different fixations. Brain sections (8 μm) were fixed with DEPC-dH2O (unfixed), 4% PFA, 70% ethanol, 95% ethanol, acetone, or methanol for 5 min at room temperature. Some brain sections fixed with 4% PFA were also treated with proteinase K overnight. After fixations, brain sections were incubated in DEPC-dH2O for 0, 3 and 20 h at room temperature. RT-PCR using β-actin primers was performed with total RNA extracted from each section scratch at the time points. β-actin mRNA was well amplified in the ethanol-, methanol- and acetone-fixed sections at all time points, indicating mRNA preservation sufficient for utilization in RT-PCR. PFA, paraformaldehyde; PK, proteinase K; EtOH, ethanol.
Figure 6
Figure 6
Total RNA isolated from brain tissue after different fixations. Brain tissue (50 mg each) was fixed with DEPC-dH2O (unfixed), 4% PFA, 70% ethanol, 95% ethanol, acetone, or methanol for 1 h on ice. Some brain tissue fixed with 4% PFA was also treated with proteinase K overnight. After fixations, brain tissue was incubated in DEPC-dH2O for 0, 3 and 20 h at room temperature. Total RNA was extracted at the time points and visualized in formaldehyde RNA gels. 5 μg per each sample except PFA and PFA-proteinase K samples (less than 0.5 μg) were loaded. Ethanol-, acetone-, methanol- and un-fixed samples showed intact RNA at 0 h, but showed partially degraded RNA at 3 and 20 h. Total RNA from PFA and PFA-proteinase K samples was scarcely visualized at all time points. PFA, paraformaldehyde; PK, proteinase K; EtOH, ethanol.
Figure 7
Figure 7
Photomicrographs of X-Gal staining after different fixations in the cortex 1 h following LiCl (0.15 M, 40 ml/kg, i.p.). PFA, paraformaldehyde; EtOH, ethanol. Scale bar, 50 μm.
Figure 8
Figure 8
Laser capture microdissection (LCM) of β-Gal-positive single cells in the CeA. An X-Gal stained and dehydrated 8 μm brain section of a LiCl-treated transgenic mouse is shown before (A) and after (B) microdissection of β-Gal-positive single cells in the CeA. Blue spots in circles indicate β-Gal-positive cells (A). Scale bar, 20 μm.
Figure 9
Figure 9
RT-PCR products of c-fos (bottom panel) and β-actin (top panels) after LCM of β-Gal-positive single cells. Brain sections (8 μm) from a LiCl-treated transgenic mouse were fixed with 70% ethanol and then stained in X-Gal reaction buffer for 16 h at 37°C. β-Gal-positive single cells were microdissected in the cortex, hippocampus and CeA. The total RNA extract from each LCM sample of single cells (15–20 single cells for β-actin and 30–40 single cells for c-Fos) was used in each RT-PCR reaction. The amplified c-fos (bottom panel) and β-actin (top panels) bands confirmed mRNA expression of c-fos and β-actin genes in LiCl-induced β-Gal-positive cells in the CeA, cortex and hippocampus of the transgenic mice. CeA, central amygdala; Hippo, hippocampus.

Similar articles

Cited by

References

    1. Basheer R, Sherin JE, Saper CB, Morgan JI, McCarley RW, Shiromani PJ. Effects of sleep on wake-induced c-fos expression. J Neurosci. 1997;17:9746–50. - PMC - PubMed
    1. Bhattacherjee V, Mukhopadhyay P, Singh S, Roberts E, Hackmiller R, Greene R, Pisano M. Laser capture microdissection of fluorescently labeled embryonic cranial neural crest cells. Genesis. 2004;39:58–64. - PubMed
    1. Bonner RF, Emmert-Buck M, Cole K, Pohida T, Chuaqui R, Goldstein S, Liotta LA. Laser capture microdissection: molecular analysis of tissue. Science. 1997;278:1481–1483. - PubMed
    1. Bravo R, Neuberg M, Burckhardt J, Almendral J, Wallich R, Müller R. Involvement of common and cell type-specific pathways in c-fos gene control: stable induction of cAMP in macrophages. Cell. 1987;48:251–60. - PubMed
    1. Chiu R, Boyle WJ, Meek J, Smeal T, Hunter T, Karin M. The c-Fos protein interacts with c-Jun/AP-1 to stimulate transcription of AP-1 responsive genes. Cell. 1988;54:541–2. - PubMed

Publication types

MeSH terms