

Painful stimuli evoke potentials recorded from the medial temporal lobe in humans
- PMID: 19925853
- PMCID: PMC2815048
- DOI: 10.1016/j.neuroscience.2009.11.026
Painful stimuli evoke potentials recorded from the medial temporal lobe in humans
Abstract
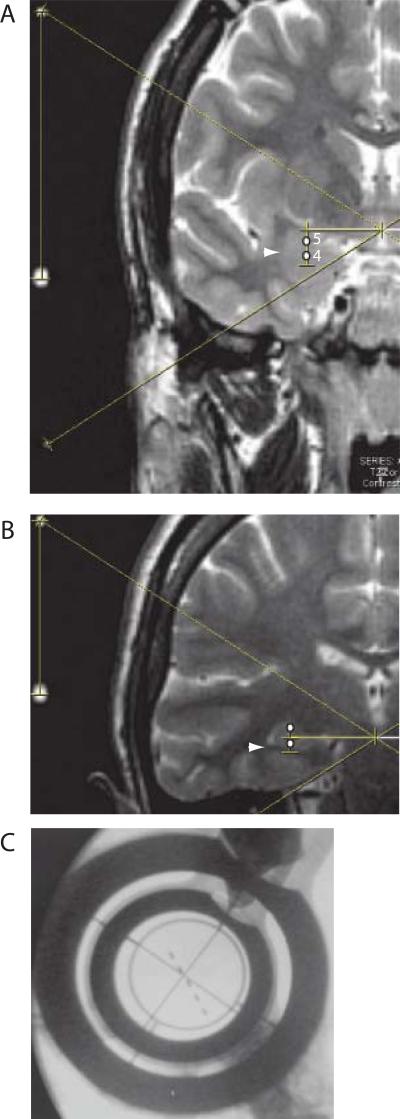
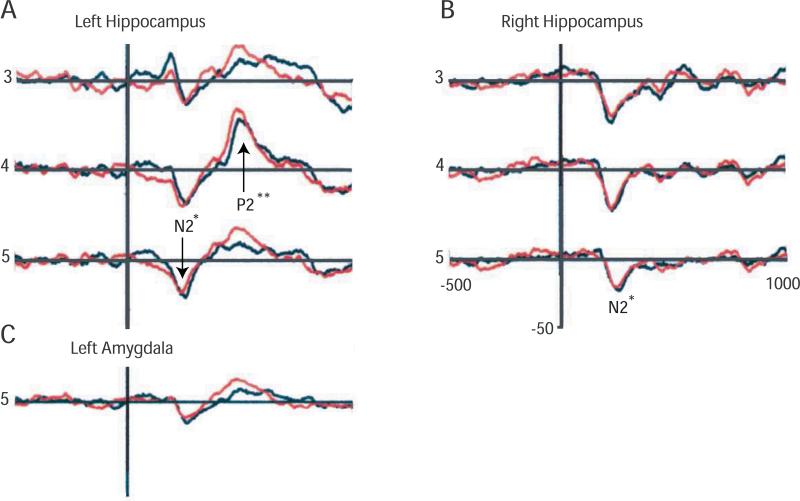
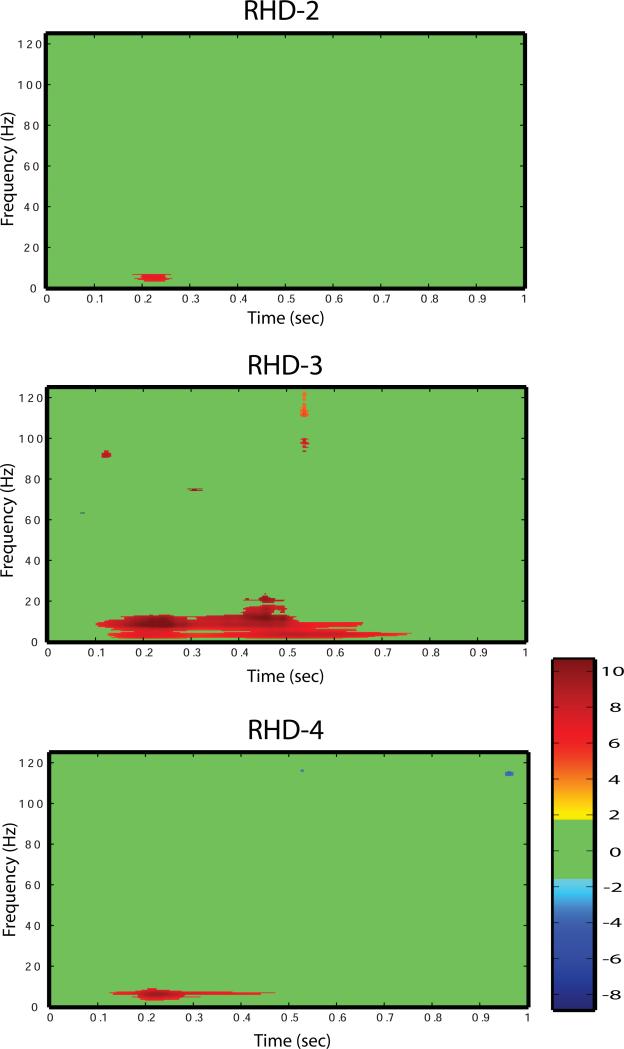
The role of human medial temporal structures in fear conditioning has led to the suggestion that neurons in these structures might respond to painful stimuli. We have now tested the hypothesis that recordings from these structures will demonstrate potentials related to the selective activation of cutaneous nociceptors by a painful laser stimulus (laser evoked potential, LEP) (Kenton B, Coger R, Crue B, Pinsky J, Friedman Y, Carmon A (1980) Neurosci Lett 17:301-306). Recordings were carried out through electrodes implanted bilaterally in these structures for the investigation of intractable epilepsy. Reproducible LEPs were commonly recorded both bilaterally and unilaterally, while LEPs were recorded at contacts on the left (9/14, P=0.257) as commonly as on the right (5/14), independent of the hand stimulated. Along electrodes traversing the amygdala the majority of LEPs were recorded from dorsal contacts near the central nucleus of the amygdala and the nucleus basalis. Stimulus evoked changes in theta activity were observed at contacts on the right at which isolated early negative LEPs (N2*) responses could be recorded. Contacts at which LEPs could be recorded were as commonly located in medial temporal structures with evidence of seizure activity as on those without. These results demonstrate the presence of pain-related inputs to the medial temporal lobe where they may be involved in associative learning to produce anxiety and disability related to painful stimuli.
Figures
Similar articles
-
Painful laser stimuli induce directed functional interactions within and between the human amygdala and hippocampus.Neuroscience. 2011 Mar 31;178:208-17. doi: 10.1016/j.neuroscience.2011.01.029. Epub 2011 Jan 20. Neuroscience. 2011. PMID: 21256929 Free PMC article.
-
Amplitudes of laser evoked potential recorded from primary somatosensory, parasylvian and medial frontal cortex are graded with stimulus intensity.Pain. 2004 Jul;110(1-2):318-28. doi: 10.1016/j.pain.2004.04.009. Pain. 2004. PMID: 15275782
-
Painful stimuli evoke potentials recorded over the human anterior cingulate gyrus.J Neurophysiol. 1998 Apr;79(4):2231-4. doi: 10.1152/jn.1998.79.4.2231. J Neurophysiol. 1998. PMID: 9535984 Clinical Trial.
-
Modulation of trigeminal laser evoked potentials and laser silent periods by homotopical experimental pain.Pain. 2002 Jul;98(1-2):217-28. doi: 10.1016/s0304-3959(02)00049-0. Pain. 2002. PMID: 12098634
-
Brain generators of laser-evoked potentials: from dipoles to functional significance.Neurophysiol Clin. 2003 Dec;33(6):279-92. doi: 10.1016/j.neucli.2003.10.008. Neurophysiol Clin. 2003. PMID: 14678842 Review.
Cited by
-
Behavioral, Physiological and EEG Activities Associated with Conditioned Fear as Sensors for Fear and Anxiety.Sensors (Basel). 2020 Nov 26;20(23):6751. doi: 10.3390/s20236751. Sensors (Basel). 2020. PMID: 33255916 Free PMC article. Review.
-
Sex dimorphism in a mediatory role of the posterior midcingulate cortex in the association between anxiety and pain sensitivity.Exp Brain Res. 2016 Nov;234(11):3119-3131. doi: 10.1007/s00221-016-4710-9. Epub 2016 Jun 24. Exp Brain Res. 2016. PMID: 27342977
-
Optogenetic Manipulations of Amygdala Neurons Modulate Spinal Nociceptive Processing and Behavior Under Normal Conditions and in an Arthritis Pain Model.Front Pharmacol. 2021 May 25;12:668337. doi: 10.3389/fphar.2021.668337. eCollection 2021. Front Pharmacol. 2021. PMID: 34113253 Free PMC article.
-
Dipole source analyses of laser evoked potentials obtained from subdural grid recordings from primary somatic sensory cortex.J Neurophysiol. 2011 Aug;106(2):722-30. doi: 10.1152/jn.00135.2011. Epub 2011 May 18. J Neurophysiol. 2011. PMID: 21593389 Free PMC article.
-
Nasal application of neuropeptide S inhibits arthritis pain-related behaviors through an action in the amygdala.Mol Pain. 2014 May 29;10:32. doi: 10.1186/1744-8069-10-32. Mol Pain. 2014. PMID: 24884567 Free PMC article.
References
-
- al-Rodhan N, Chipkin R, Yaksh TL. The antinociceptive effects of SCH-32615, a neutral endopeptidase enkephalinase inhibitor, microinjected into the periaqueductal, ventral medulla and amygdala. Brain Res. 1990;520:123–130. - PubMed
-
- Apkarian AV, Bushnell MC, Treede R-D, Zubieta JK. Human brain mechanisms of pain perception and regulation in health and disease. European Journal of Pain. 2005;9:463–484. - PubMed
-
- Baker KB, Tkach JA, Nyenhuis JA, Phillips M, Shellock FG, Gonzalez-Martinez J, Rezai AR. Evaluation of specific absorption rate as a dosimeter of MRI-related implant heating. J Magn Reson Imaging. 2004;20:315–320. - PubMed
-
- Becerra LR, Breiter HC, Stojanovic M, Fishman S, Edwards A, Comite AR, Gonzalez RG, Borsook D. Human brain activation under controlled thermal stimulation and habituation to noxious heat: an fMRI study. Magn Res Med. 1999;41:1044–1057. - PubMed
-
- Benjamini Y, Yekutieli Y. The control of the false discovery rate under dependency. Ann Stat. 2001:1165–1188.
Publication types
MeSH terms
Grants and funding
LinkOut - more resources
Full Text Sources
Medical
Miscellaneous
