. 2011 Sep;32(9):1588-98.
doi: 10.1016/j.neurobiolaging.2009.10.013. Epub 2009 Nov 18.

White matter hyperintensities and cognition: testing the reserve hypothesis

Affiliations

White matter hyperintensities and cognition: testing the reserve hypothesis

Adam M Brickman et al. Neurobiol Aging. 2011 Sep.

Abstract

Objective: White matter hyperintensities (WMH), visualized on T2-weighted MRI, are thought to reflect small-vessel vascular disease. Much like other markers of brain disease, the association between WMH and cognition is imperfect. The concept of reserve may account for this imperfect relationship. The purpose of this study was to test the reserve hypothesis in the association between WMH severity and cognition. We hypothesized that individuals with higher amounts of reserve would be able to tolerate greater amounts of pathology than those with lower reserve.

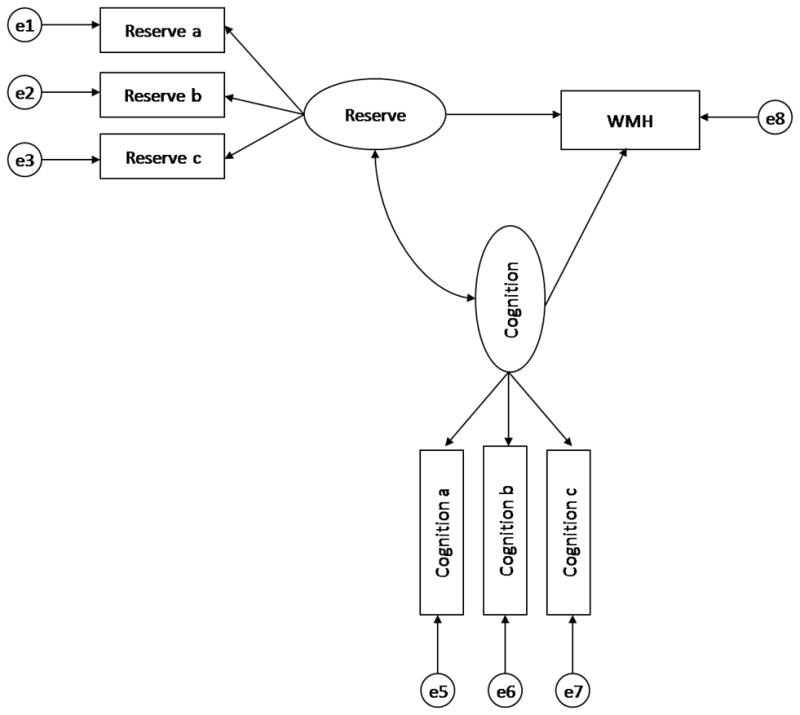
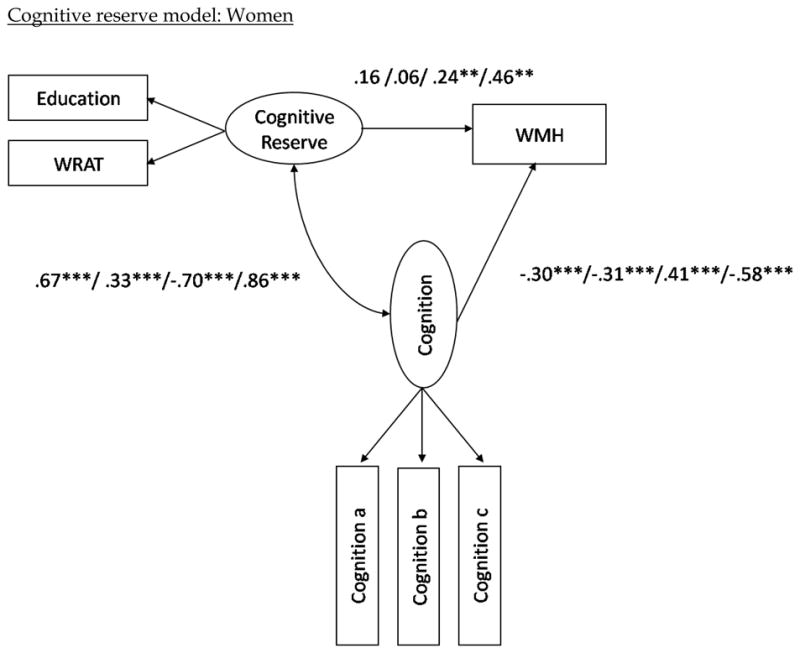
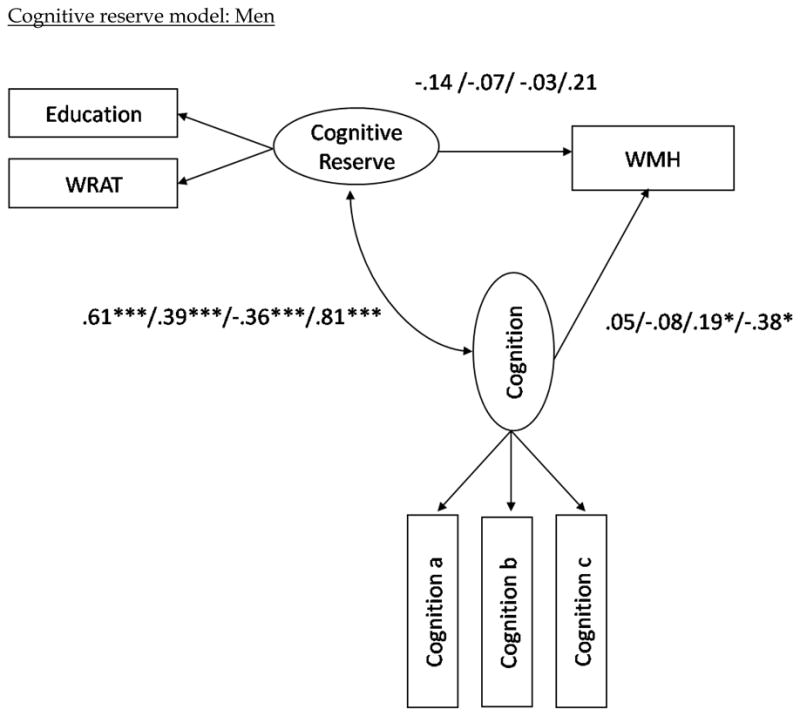
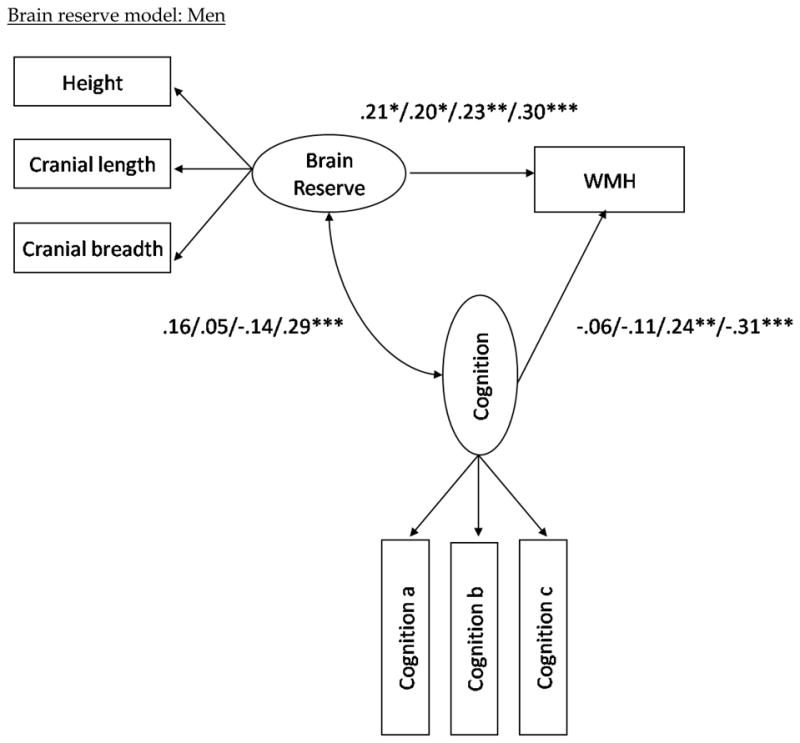
Methods: Neurologically healthy older adults (n=717) from a community-based study received structural MRI, neuropsychological assessment, and evaluation of reserve. WMH volume was quantified algorithmically. We derived latent constructs representing four neuropsychological domains, a measure of cognitive reserve, and a measure of brain reserve. Measures of cognitive and brain reserve consisted of psychosocial (e.g., education) and anthropometric (e.g., craniometry) variables, respectively.

Results: Increased WMH volume was associated with poorer cognition and higher cognitive and brain reserve were associated with better cognition. Controlling for speed/executive function or for language function, those with higher estimates of cognitive reserve had significantly greater degrees of WMH volume, particularly among women. Controlling for cognitive functioning across all domains, individuals with higher estimates of brain reserve had significantly greater WMH volume.

Conclusions: For any given level of cognitive function, those with higher reserve had more pathology in the form of WMH, suggesting that they are better able to cope with pathology than those with lower reserve. Both brain reserve and cognitive reserve appear to mitigate the impact of pathology on cognition.


Figures

Figure 1
Figure 1
General structural equation model. Latent constructs are represented by ovals. Observed (measured) variables are represented by rectangles. The latent variables labeled “e” represent the unique and error variance associated with each observed variable, which are assumed to be uncorrelated with each other.
Figure 2
Figure 2
Structural model with path coefficients for cognitive reserve (top two) and brain reserve (bottom two) across the three cognition constructs in the female and male subgroups, respectively. Note (Figure 2). The first path coefficients correspond to the values when visual-spatial ability is included as the latent cognition construct in the model. The second set of path coefficients correspond to the values when memory is included as the latent cognition construct in the model; the third numbers are when in executive/speed construct is included; the fourth number is when language is included as the latent cognition construct; i.e. visual-spatial ability/memory/executive-speed/language. The variables “Cognition a, b, and c” refer to the measured variables that comprise each of the cognitive domains (e.g., Color Trails 1 and 2 for speed/executive.) Note that higher scores in the executive/speed domain correspond to poorer performance, whereas higher scores in all other domains correspond to better performance. Also note that although error terms were estimated in the models, they are excluded from the path diagrams in order to simplify the figures. *p < .05. **p<.01. ***p< .001
Figure 2
Figure 2
Structural model with path coefficients for cognitive reserve (top two) and brain reserve (bottom two) across the three cognition constructs in the female and male subgroups, respectively. Note (Figure 2). The first path coefficients correspond to the values when visual-spatial ability is included as the latent cognition construct in the model. The second set of path coefficients correspond to the values when memory is included as the latent cognition construct in the model; the third numbers are when in executive/speed construct is included; the fourth number is when language is included as the latent cognition construct; i.e. visual-spatial ability/memory/executive-speed/language. The variables “Cognition a, b, and c” refer to the measured variables that comprise each of the cognitive domains (e.g., Color Trails 1 and 2 for speed/executive.) Note that higher scores in the executive/speed domain correspond to poorer performance, whereas higher scores in all other domains correspond to better performance. Also note that although error terms were estimated in the models, they are excluded from the path diagrams in order to simplify the figures. *p < .05. **p<.01. ***p< .001

References

    1. Abbott RD, White LR, Ross GW, Petrovitch H, Masaki KH, Snowdon DA, Curb JD. Height as a marker of childhood development and late-life cognitive function: the Honolulu-Asia Aging Study. Pediatrics. 1998;102:602–9. - PubMed
    1. Arbuckle JL. Amos 5.0. SPSS; Chicago, IL: 2003.
    1. Benton AL. The Visual Retention Test. The Psychological Corporation; New York: 1955.
    1. Bishop EG, Dickson AL, Allen MT. Psychometric intelligence and performance on Selective Reminding. The Clinical Neuropsychologist. 1990;4:141–150.
    1. Brickman AM, Buchsbaum MS. Alzheimer’s disease and normal aging: Neurostructures. In: Byrne JH, editor. Learning and Memory: A Comprehensive Reference. Elsevier; New York: 2008. pp. 601–621.

Publication types

MeSH terms