. 2010 Jan;16(1):197-210.
doi: 10.1261/rna.1622010. Epub 2009 Nov 19.

Poly(A) signal-dependent degradation of unprocessed nascent transcripts accompanies poly(A) signal-dependent transcriptional pausing in vitro

Affiliations

Poly(A) signal-dependent degradation of unprocessed nascent transcripts accompanies poly(A) signal-dependent transcriptional pausing in vitro

Amir Kazerouninia et al. RNA. 2010 Jan.

Abstract

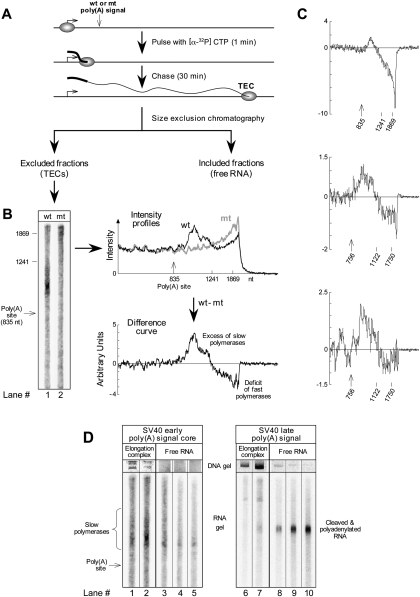
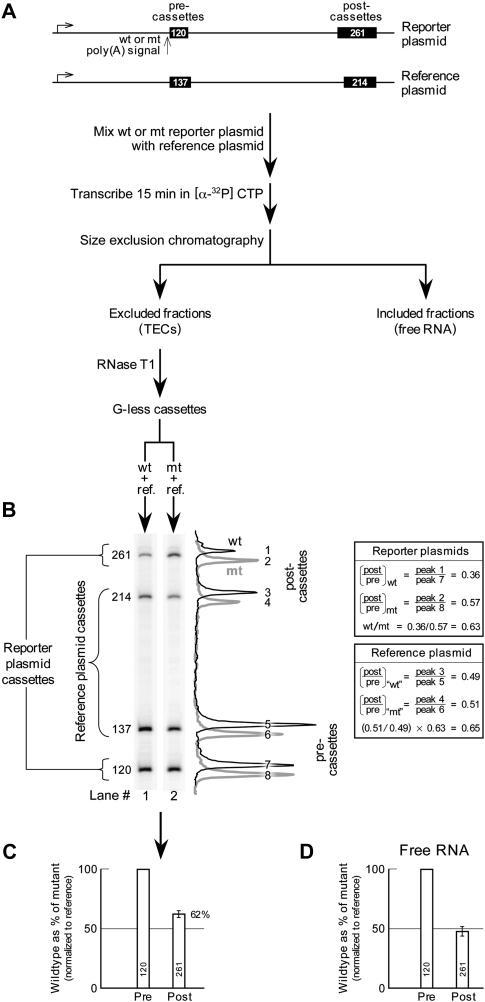
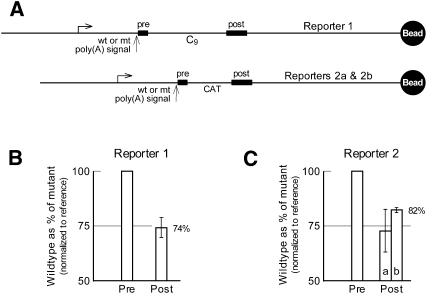
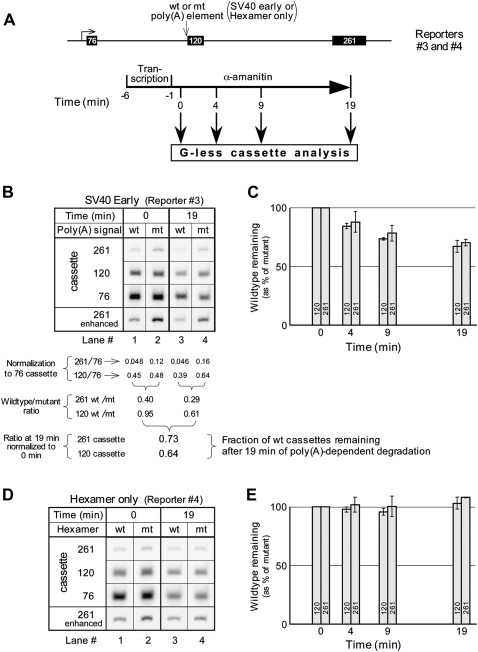
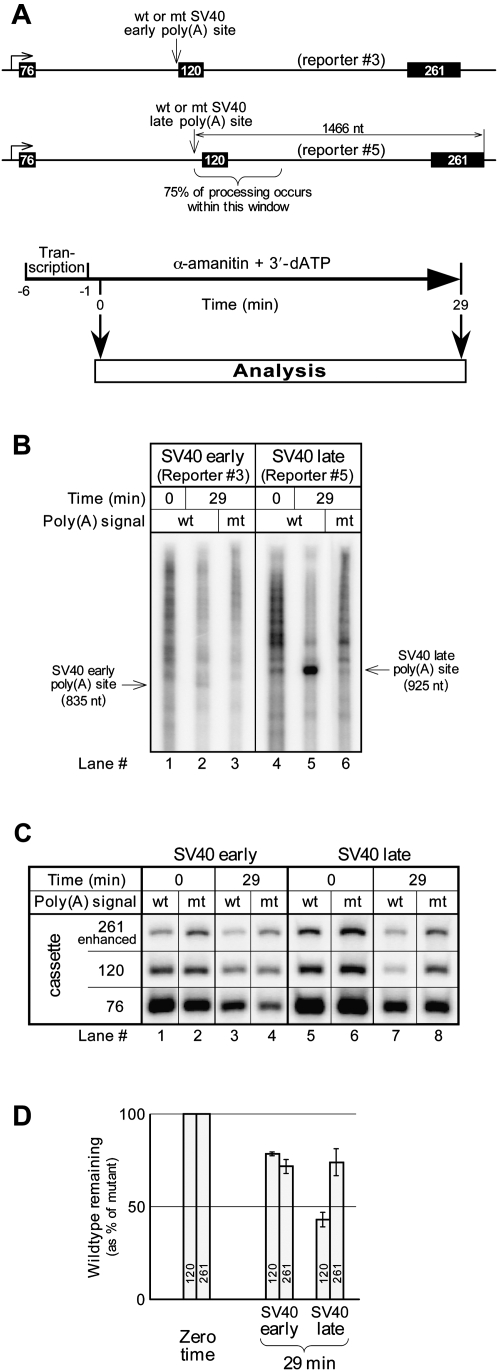
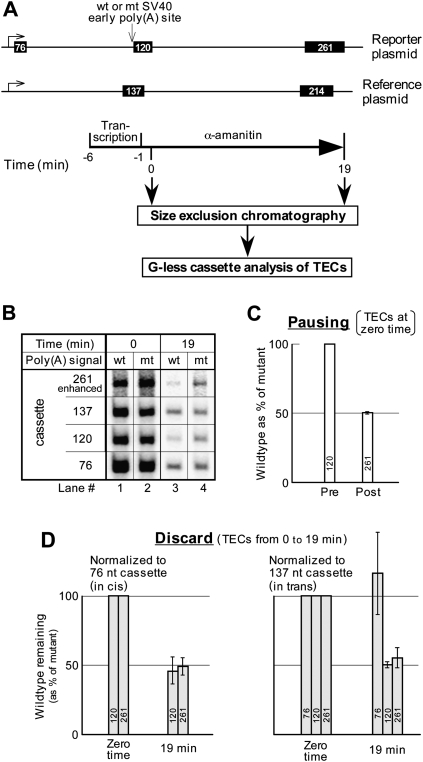
The poly(A) signal has long been known for its role in directing the cleavage and polyadenylation of eukaryotic mRNA. In recent years its additional coordinating role in multiple related aspects of gene expression has also become increasingly clear. Here we use HeLa nuclear extracts to study two of these activities, poly(A) signal-dependent transcriptional pausing, which was originally proposed as a surveillance checkpoint, and poly(A) signal-dependent degradation (PDD) of unprocessed transcripts from weak poly(A) signals. We confirm directly, by measuring the length of RNA within isolated transcription elongation complexes, that a newly transcribed poly(A) signal reduces the rate of elongation by RNA polymerase II and causes the accumulation of elongation complexes downstream from the poly(A) signal. We then show that if the RNA in these elongation complexes contains a functional but unprocessed poly(A) signal, degradation of the transcripts ensues. The degradation depends on the unprocessed poly(A) signal being functional, and does not occur if a mutant poly(A) signal is used. We suggest that during normal 3'-end processing the uncleaved poly(A) signal continuously samples competing reaction pathways for processing and for degradation, and that in the case of weak poly(A) signals, where poly(A) site cleavage is slow, the default pathway to degradation predominates.


Figures

FIGURE 1.
FIGURE 1.
Survey of paused polymerases by transcript analysis. (A) Experimental protocol. DNA from Reporter 3 was transcribed in vitro using a pulse-chase format very similar to that of Rigo et al. (2005), and then TECs were isolated by size fractionation in the presence of 1 M NaCl and 1% Sarkosyl. A fourfold increase over the typical reaction size was used. The length of the pulse was chosen to be short enough to preclude any polymerases from reaching the poly(A) site before the start of the chase. (B) Comparison of TEC fractions for wild-type and mutant versions of the reporter. Size calibrations are based on RNA transcribed from the same or similar template in the presence of complementary DNA oligonucleotides that direct RNase H to cut the RNA at specified locations (Rigo et al. 2005). TECs (identified by the presence of plasmid DNA) eluted from the column in fractions 8 and 9 for the wild type and in fractions 7 and 8 for the mutant. Gel lanes 1 and 2 show column fractions 9 and 8, respectively. However, the intensity profiles to the right of the gel show the summed intensities for both TEC fractions eluting from the column. In preparing these profiles, the data were background corrected and normalized, as described below, to control for variations in the amount of template used in the different transcription reactions and for variations in sample recovery. First, the background in the gel above the region containing RNA was subtracted from the signal in all lanes, bringing the far right of the line graphs to zero. Then, the remaining signal in each lane was normalized at each position to the sum of the signal for TECs that had not reached the poly(A) signal. Thus, the average signal to the left of the poly(A) site for each graph is identical, by definition—as it should be, since the wild-type and mutant templates are identical upstream of the poly(A) signal. The difference curve was calculated by subtracting the mutant intensity profile from the wild-type one and expressing the result in arbitrary units related to the fraction of all RNA produced in the experiment. (C) Difference curves from three additional experiments. Reporters 3 and 2a were used for the top panel and for the bottom two panels, respectively. (D) Gel-electrophoretic analysis of RNA and DNA from size fractionated transcription reactions for poly(A) signals that either do not (lanes 1–5) or do (lanes 6–10) process efficiently in vitro. Fractions 8, 9, 11, 12, and 13 are shown for the SV40 early column, and fractions 7, 8, 10, 11, and 12 are shown for the SV40 late column. Transcription and processing of the SV40 late RNA was exactly as described in Rigo et al. (2005) with a 2-min pulse and a 13-min chase. Lane 2 in D is the same as lane 1 in B.
FIGURE 2.
FIGURE 2.
Poly(A) signal-dependent pausing in vitro on circular templates. (A) Experimental protocol with plasmid templates drawn to scale. In vitro transcriptions for column separation were carried out as described previously (Nag et al. 2006) using Reporter 1. (B) Cassette analysis of the principal TEC column fraction (fraction 8) for a wild-type and a mutant transcription reaction. The signal intensities of the cassette bands in the wild-type and mutant gel lanes are presented as line graphs, which are offset slightly to enhance clarity. Some key ratios are given in the table. The “wt” and “mt” designations in the case of the reference plasmid cassette ratios refer to transcription mixtures where the reporter was either wild type or mutant (although the same reference plasmid was used for both). (C) Overall cassette analysis for the TEC fractions. Data were summed over the two TEC fractions 7 and 8 for the experiment in B, and the resulting reporter wt/mt ratio was normalized to the reference wt/mt ratio. The experiment was repeated, and the average and range of values obtained is shown. There is no error bar for the 120-nt cassette because normalization was to this cassette so that this value, by definition, is 100%. (D) Cassette analysis of a representative free RNA fraction 11 for the experiment in B, normalized to the reference and then averaged across two experiments as in C.
FIGURE 3.
FIGURE 3.
Poly(A) signal-dependent pausing in vitro on immobilized templates. (A) The immobilized reporter DNAs drawn to scale. Transcription was carried out as for Figure 2. (B) Cassette analysis for washed TECs isolated using Reporter 1. The average and standard deviation for three independent experiments is shown. (C) Cassette analysis for washed TECs isolated using Reporters 2a and 2b (independently cloned, presumably identical plasmids; see Materials and Methods). The average and range for two independent experiments is shown for reporter 2a, and the average and standard deviation for three independent experiments is shown for reporter 2b. Note that four out of the five results obtained clustered around the value of 82%. We consider the one low value (the 63% for reporter 2a) to be an outlier.
FIGURE 4.
FIGURE 4.
Poly(A) signal-dependent degradation in vitro. (A) Reporter construct drawn to scale, and the experimental protocol. Transcription was carried out according to Nag et al. (2006) with minor variations. The reaction was scaled up fivefold and transcription was stopped after 5 min by adding 5 μL of 0.5 μg/μL α-Amanitin. At the time intervals indicated, 13.5 μL aliquots were withdrawn and digested with RNase T1 in the presence of EDTA. (B) A gel showing the G-less cassette bands from the 0- and 19-min time points of an SV40 early PDD analysis. (C) A quantitative summary of several SV40 early PDD analyses, calculated as shown beneath the gel of part B. The averages and standard deviations for the 19-min time point are from six independent experiments, and for the 5- and 9-min time points from four independent experiments. The averages include data from both Reporters 3a and 3b (independently cloned, presumably identical plasmids; see Materials and Methods). (D) A gel showing the G-less cassette bands from the 0- and 19-min time points of a PDD analysis of Reporter 4, which contains two AATAAA hexamers in place of a poly(A) signal. (E) A quantitative summary showing the averages and ranges from two independent experiments. The range for the 261-nt cassette at 19 min was too small to be visible in the graph.
FIGURE 5.
FIGURE 5.
Poly(A) signal-dependent degradation in the presence and absence of processing. (A) Reporter constructs drawn to scale, and the experimental protocol. (B) Direct analysis of transcripts on a gel. (C) G-less cassettes from the transcripts. (D) A quantitative summary, calculated as for Figure 4C, showing the averages and ranges from two independent experiments. For purposes of normalization to the 76-nt cassette, we assume the stability of cleaved, but nonpolyadenylated RNA is similar to that of uncleaved RNA in our system.
FIGURE 6.
FIGURE 6.
Poly(A) signal-dependent degradation is coupled to transcription. (A) Reporter 3 and the reference plasmid drawn to scale, together with the experimental protocol. (B) G-less cassettes from the transcripts in the peak fraction of the column excluded volume. (C) Pausing analysis at the zero time point of the TECs in the principal two fractions of the column excluded volume, showing the average and range from two independent experiments. Cassette analysis was as for Figure 2C but without normalization to the transcripts from the reference plasmid, because the 214-nt cassette band had insufficient counts for quantitation in one of the experiments. (D) PDD analysis of TECs at the 19-min time point. Two types of normalization are shown. Either the two downstream cassettes from the reporter transcripts were normalized to the 76-nt cassette as in Figure 4, or all three reporter cassettes were normalized to the 137-nt reference cassette. The average and range for two independent experiments is shown. Note that whereas the wild-type/mutant ratio for the 261-nt cassette is less than that for the 120-nt cassette in C, the two cassettes are shown as being the same at zero time (both 100%) in D. This is simply a consequence of our standard transcript degradation analysis, for which the 120-nt and the 261-nt cassette levels at all time points are normalized to the respective levels for these cassettes found at the 0 time point (see Fig. 4B). Thus, the equal zero time values in D simply reflect self-normalization at this time point.

Similar articles

Cited by

References

    1. Andrews EM, DiMaio D. Hierarchy of polyadenylation site usage by bovine papillomavirus in transformed mouse cells. J Virol. 1993;67:7705–7710. - PMC - PubMed
    1. Andrulis ED, Werner J, Nazarian A, Erdjument-Bromage H, Tempst P, Lis JT. The RNA processing exosome is linked to elongating RNA polymerase II in Drosophila. Nature. 2002;420:837–841. - PubMed
    1. Boireau S, Maiuri P, Basyuk E, de la Mata M, Knezevich A, Pradet-Balade B, Backer V, Kornblihtt A, Marcello A, Bertrand E. The transcriptional cycle of HIV-1 in real-time and live cells. J Cell Biol. 2007;179:291–304. - PMC - PubMed
    1. Burkard KT, Butler JS. A nuclear 3′–5′ exonuclease involved in mRNA degradation interacts with Poly(A) polymerase and the hnRNA protein npl3p. Mol Cell Biol. 2000;20:604–616. - PMC - PubMed
    1. Calvo O, Manley JL. Strange bedfellows: Polyadenylation factors at the promoter. Genes & Dev. 2003;17:1321–1327. - PubMed

Publication types

MeSH terms

LinkOut - more resources