. 2009 Dec;151(4):1703-28.
doi: 10.1104/pp.109.136804. Epub 2009 Nov 19.

Genetic resources for maize cell wall biology

Affiliations

Genetic resources for maize cell wall biology

Bryan W Penning et al. Plant Physiol. 2009 Dec.

Abstract

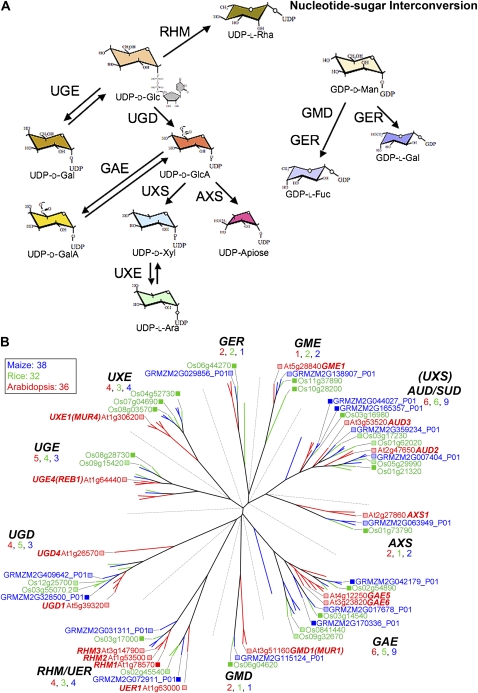
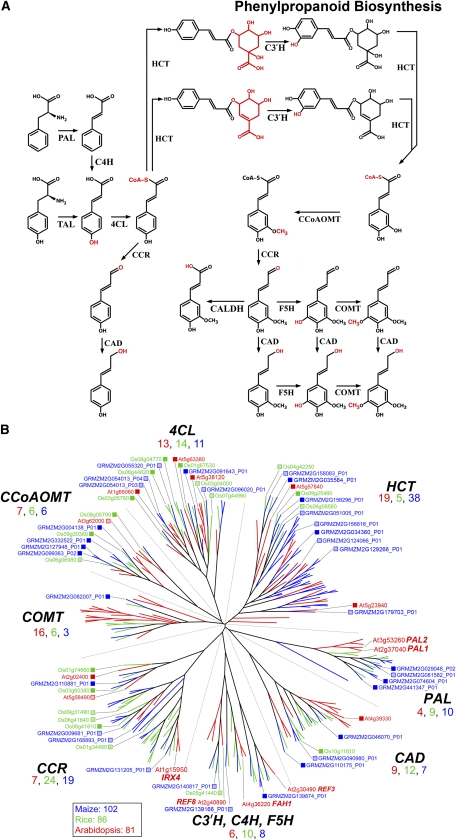
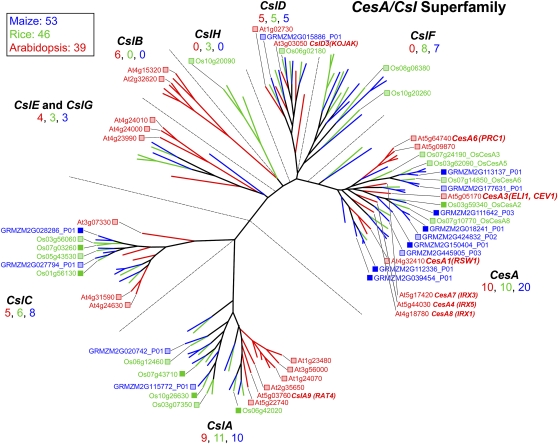
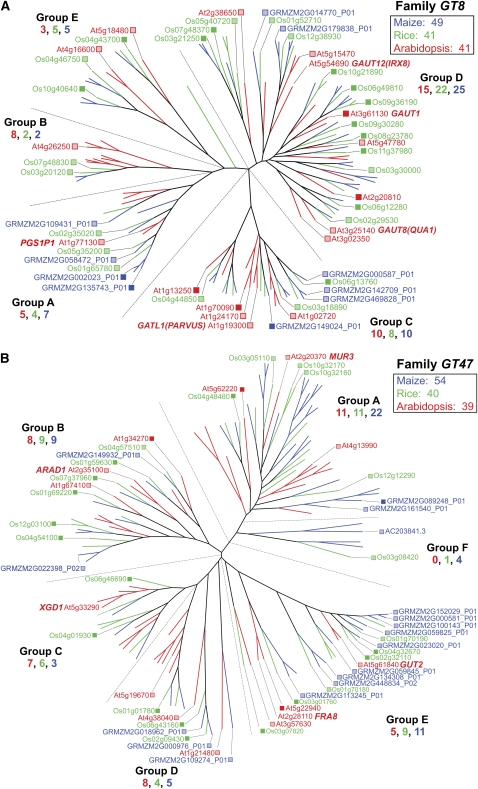
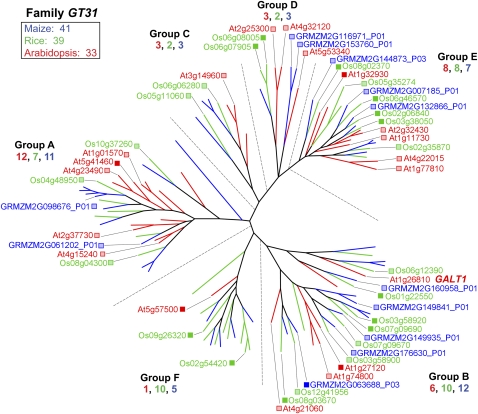
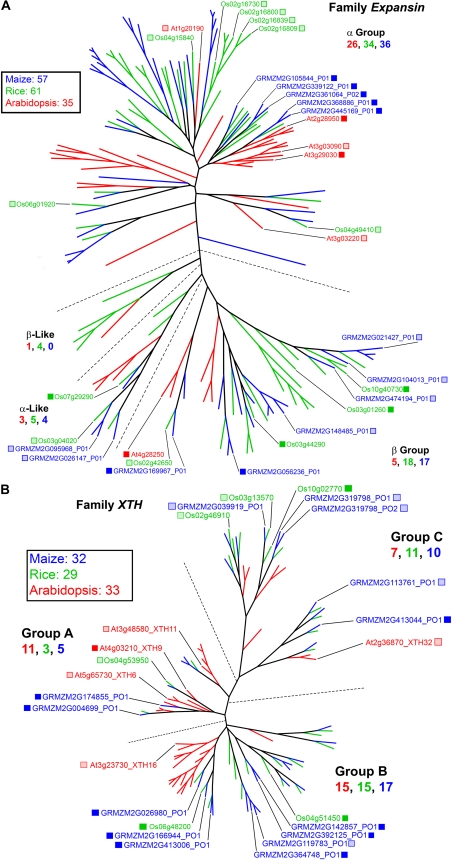
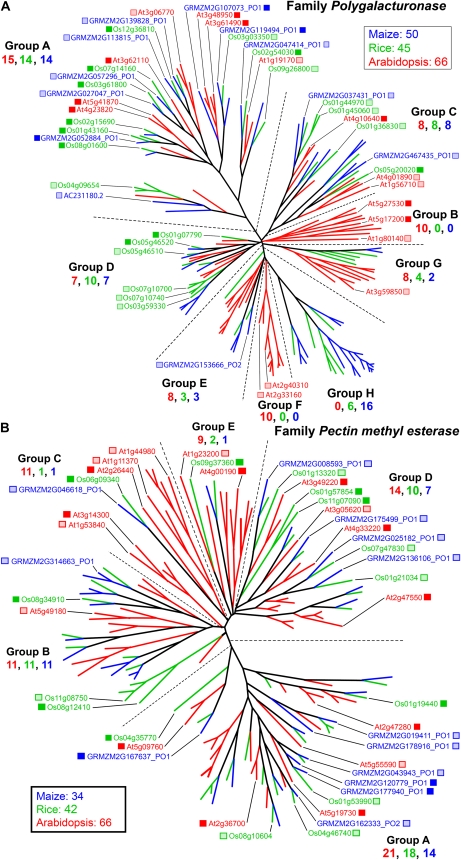
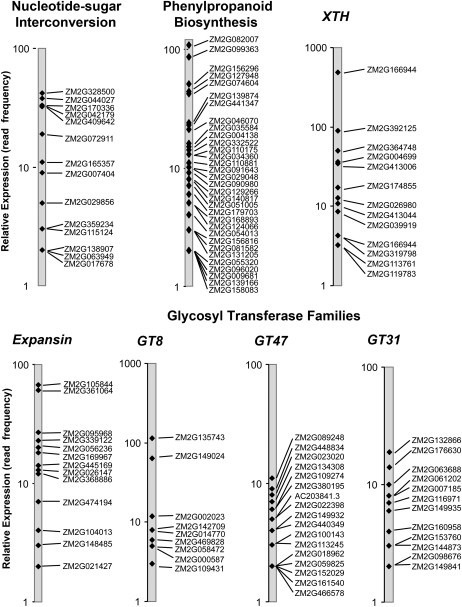
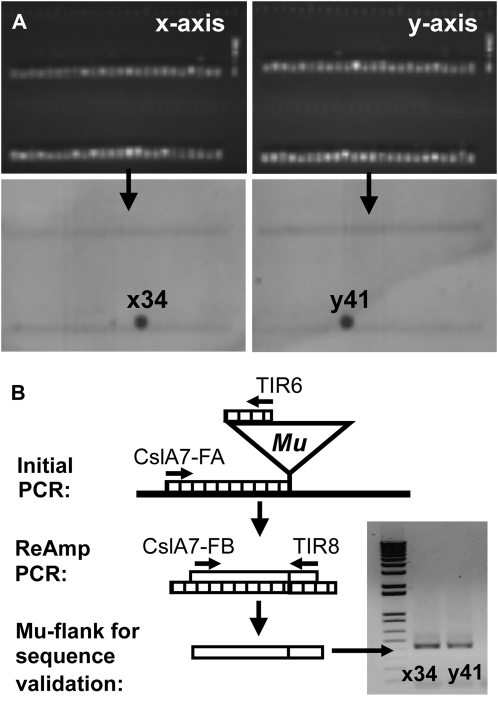
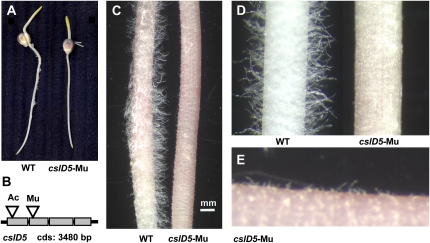
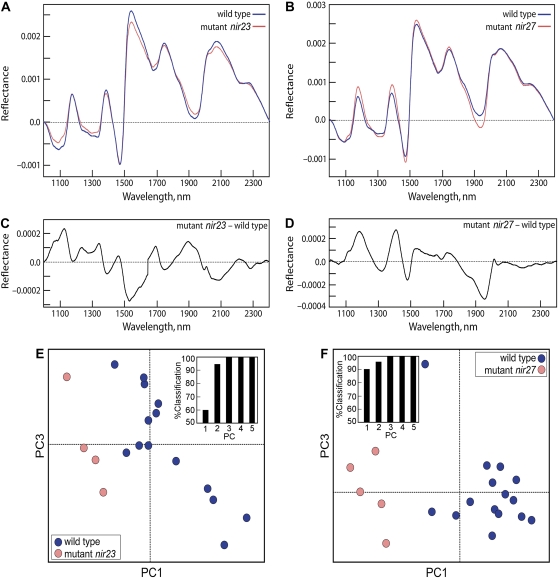
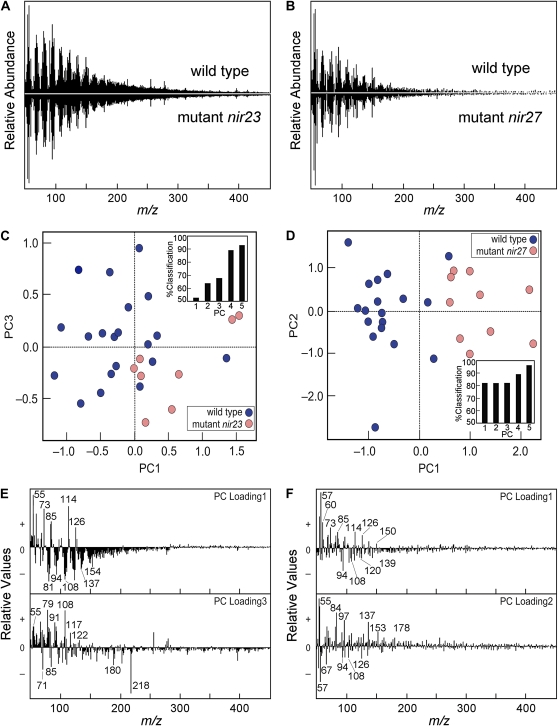
Grass species represent a major source of food, feed, and fiber crops and potential feedstocks for biofuel production. Most of the biomass is contributed by cell walls that are distinct in composition from all other flowering plants. Identifying cell wall-related genes and their functions underpins a fundamental understanding of growth and development in these species. Toward this goal, we are building a knowledge base of the maize (Zea mays) genes involved in cell wall biology, their expression profiles, and the phenotypic consequences of mutation. Over 750 maize genes were annotated and assembled into gene families predicted to function in cell wall biogenesis. Comparative genomics of maize, rice (Oryza sativa), and Arabidopsis (Arabidopsis thaliana) sequences reveal differences in gene family structure between grass species and a reference eudicot species. Analysis of transcript profile data for cell wall genes in developing maize ovaries revealed that expression within families differed by up to 100-fold. When transcriptional analyses of developing ovaries before pollination from Arabidopsis, rice, and maize were contrasted, distinct sets of cell wall genes were expressed in grasses. These differences in gene family structure and expression between Arabidopsis and the grasses underscore the requirement for a grass-specific genetic model for functional analyses. A UniformMu population proved to be an important resource in both forward- and reverse-genetics approaches to identify hundreds of mutants in cell wall genes. A forward screen of field-grown lines by near-infrared spectroscopic screen of mature leaves yielded several dozen lines with heritable spectroscopic phenotypes. Pyrolysis-molecular beam mass spectrometry confirmed that several nir mutants had altered carbohydrate-lignin compositions.


Figures

Figure 1.
Figure 1.
Genes of the nucleotide-sugar interconversion pathways. A, Schematic of pathways for plant nucleotide-sugar interconversion. The committed step to synthesis of uronic acids and pentoses is catalyzed by UDP-Glc dehydrogenase (UGD); isoforms exhibit different catalytic activities that indicate varied functions (Karkonen et al., 2005). The function of the UDP-GlcA decarboxylase (carboxyl-lyase) was established for the UXS family in barley (Zhang et al., 2005), with homology to the SUD/AUD group proposed for Arabidopsis (Reiter and Vanzin, 2001). Apiose, the essential monosaccharide in the boron didiester cross-linking of RG II, is synthesized by enzymes encoded by members of the AXS group, which converts irreversibly UDP-GlcA to a mixture of UDP-apiose and UDP-Xyl. A reduction in the levels of these synthases results in an RG II deficiency and cell wall abnormalities (Ahn et al., 2006). Although pectins are a minor component of the walls of grasses, an apiose-containing RG II with only slightly modified side groups is present (Thomas et al., 1989). B, These evolutionarily distinct families are combined for convenience into one dendrogram; evolutionary relationships are relevant only within a single family. Three groups of C-4 epimerases have been annotated: the UDP-Glc 4-epimerases (UGEs), including REB1, that interconvert UDP-Glc and UDP-Gal (Seifert et al., 2002; Nguema-Ona et al., 2006); the UDP-GlcA 4-epimerases (GAEs) that interconvert UDP-GlcA and UDP-GalA (Mølhøj et al., 2004; Usadel et al., 2004); and the UDP-Xyl 4-epimerases (UXEs), including MUR4, that interconvert UDP-Xyl and UDP-Ara (Burget et al., 2003). GDP-Fuc is synthesized de novo from GDP-Man via two enzymes, a 4,6-dehydratase (GMD), such as MUR1, and a 3,5-epimerase-reductase (GER; Reiter and Vanzin, 2001). For accession numbers of all genes in these families, see http://cellwall.genomics.purdue.edu/families/1-1/. Color coding for all dendrograms of gene families (Figs. 1–7; Supplemental Figs. S1–S3) are Arabidopsis (red), rice (green), and maize (blue), with numbers of genes in each group indicated. Expression levels for maize genes are indicated as the numbers of reads obtained in the sequencing runs, with 10 or more considered highly or moderately expressed (dark blue boxes), whereas one to nine reads are considered low expression (light blue boxes). Maize gene expression was compared with Arabidopsis and rice expression in developing ovary from public sources, primarily NCBI Gene Expression Omnibus (Barrett et al., 2007), as visualized in Genevestigator (https://www.genevestigator.ethz.ch/). Genevestigator was the primary model where expression in ovary is compared with that in other organs and tissues. Genes minimally expressed in Arabidopsis and rice are noted with light red and light green boxes, respectively, whereas genes moderately to highly expressed are noted with dark red and dark green boxes. Whether expressed or not, known mutants are indicated after the gene annotation.
Figure 2.
Figure 2.
Genes of phenylpropanoid substrate synthesis. A, The current view of the metabolic pathways from Phe or Tyr to hydroxycinnamic acids and monolignols. The PAL1 and PAL2 genes encoding PAL (Rohde et al., 2004) and CAD-C and CAD-D (Sibout et al., 2005) were identified as genes involved in lignification in the floral stem of Arabidopsis. The fah1 mutant lacking sinapate esters was characterized as ferulate (coniferyl aldehyde/alcohol) 5-hydroxylase (Meyer et al., 1996; Humphreys et al., 1999). An extension of a genetic screen for reduced epidermal fluorescence mutants resulted in the discovery of ref3 and ref8 (Franke et al., 2002a, 2002b), which were found to encode a cinnamate 4-hydroxylase (C4H) and a p-coumaroyl-shikimate/quinate 3′-hydroxylase (C3′H), respectively. The latter enzyme had been identified by Schoch et al. (2001) after a phylogenetic analysis of Arabidopsis cytochrome P450 enzymes. Identification of the substrate of this enzyme was aided by early studies on chlorogenic acid biosynthesis by Heller and Kühnl (1985) and Kühnl et al. (1987). Generation of p-coumaroyl-CoA from p-coumaric acid is catalyzed by HCT. This enzyme is also responsible for the transfer of the caffeoyl moiety of chlorogenic acid (caffeoyl-quinate) and caffeoyl-shikimate to CoA, based on studies by Hoffmann et al. (2003) that built on early studies by Stöckigt and Zenk (1974), Rhodes and Wooltorton (1976), and Ulbrich and Zenk (1980). Selection of irregular xylem mutants also proved helpful in identifying genes of phenylpropanoid metabolism, as the irx4 mutant was determined to result from a defective CCR gene (Jones et al., 2001). A knockout of CAFFEIC ACID O-METHYLTRANSFERASE1 (COMT1) results in lignins with strongly reduced levels of syringyl units in maize (Vignols et al., 1995) and, subsequently, in Arabidopsis (Goujon et al., 2003). 4CL, 4-Coumaric acid CoA-ligase; CALDH, coniferaldehyde dehydrogenase; CCoAOMT, caffeoyl-CoA 3-O-methyl transferase; F5H, ferulate (coniferyl alcohol/aldehyde) 5-hydroxylase; TAL, Tyr ammonia-lyase. B, These evolutionarily distinct families are combined for convenience into one dendrogram; evolutionary relationships are relevant only within a single family. Color scheme and dendrogram labeling are as described in the legend of Figure 1. For accession numbers of all genes in these families, see http://cellwall.genomics.purdue.edu/families/1-3/. Functional classification of phenylpropanoid genes in maize, rice, and Arabidopsis was based on characteristic signal peptides and motifs identified using InterProScan (http://www.ebi.ac.uk/Tools/InterProScan/) but do not imply that enzymatic function has been experimentally verified.
Figure 3.
Figure 3.
Genes of the CesA/Csl superfamily. At least three CesA genes are coexpressed during primary wall formation, and mutants in each of them, AtCesA1 (rsw1; Arioli et al., 1998), AtCesA6 (procuste; Fagard et al., 2000), and AtCesA3 (cev1; Ellis et al., 2002; eli1; Caño-Delgado et al., 2003), result in cellulose deficiencies, indicating that all three are essential for cellulose synthesis. The irregular xylem mutants AtCesA8 (irx1), AtCesA7 (irx3), and AtCesA4 (irx5) are deficient in cellulose synthesis specifically in secondary walls (Taylor et al., 2003). The root-hairless mutant kojak was traced to a mutation in the CslD3 gene proposed to be a cellulose synthase in these tip-growing cells (Favery et al., 2001). Rice CslD1 (Kim et al., 2007) and maize CslD5 are apparent orthologs, as mutations in each result in the reduced root hair phenotype. Heterologous expression of the Arabidopsis CslA9 in Drosophila cells in culture confirmed the role of this gene in mannan synthesis (Liepman et al., 2005). Expression of a barley CslF gene in Arabidopsis resulted in the de novo appearance of epitopes of the mixed-linkage (1→3),(1→4)-β-d-glucan (Burton et al., 2006), and characterization of a CslC coexpressed with a xyloglucan-specific xylosyl transferase in Pichia resulted in the synthesis of extended glucan polymers (Cocuron et al., 2007). Color scheme and dendrogram labeling are as described in the legend of Figure 1. See http://cellwall.genomics.purdue.edu/families/2-1/ for accession numbers of all genes in this superfamily.
Figure 4.
Figure 4.
Genes of major nonprocessive GT families. A, In GT8, the largest clade, group D, encodes GAUT1, the only protein established to iteratively extend GalA units typical of homogalacturonan (Sterling et al., 2006). This large family of retaining transferase genes encodes several putative GAUTs and three distinct subgroups of GATL proteins. GAUT8, or QUASIMODO1 (QUA1), is involved in the synthesis of RG II (Mouille et al., 2007), whereas the group C GATL1 and a secondary wall-associated group A member (Sterling et al., 2006) have no established function. The PARVUS gene (Lao et al., 2004) is involved in the synthesis of the tetrasaccharide primer of xylan synthesis (Lee et al., 2007a). See http://cellwall.genomics.purdue.edu/families/2-3-1/ for accession numbers of all genes in this family. B, Group A of GT47 contains MUR3, which encodes a galactosyl transferase that adds the (1→2)-β-d-Gal residue of the first xylosyl residue from the reducing end of the repeating heptasaccharide unit of xyloglucan (Madson et al., 2003). In group B, ARAD1 functions in (1→5)-α-l-arabinan synthesis (Harholt et al., 2006), and in group C, XYLOGALACTURONAN DEFICIENT1 (XGD1) encodes a xylosyl transferase that adds the (1→3)-β-Xyl units to homogalacturonan (Jensen et al., 2008). Group E contains FRAGILE FIBER8 (FRA8), which functions in the synthesis of the tetrasaccharide primer for xylan synthase (Peña et al., 2007), and putative glucuronosyl transferase genes, GUT1 and GUT2, that add substituents to secondary wall xylans (Zhong et al., 2005). Color scheme and dendrogram labeling are as described in the legend of Figure 1. For accession numbers of all genes in this family, see http://cellwall.genomics.purdue.edu/families/2-3-2/.
Figure 5.
Figure 5.
Genes of family GT31. A single member of the GT31, GALT1 from group B, has been shown to be a galactosyl transferase required in the synthesis of N-glycan hybrid structures (Strasser et al., 2007). Recent bioinformatics approaches indicate that many of the members of this family may encode (1→3)-β-galactosyl transferases (Qu et al., 2008). For accession numbers of all genes in this family, see http://cellwall.genomics.purdue.edu/families/2-3-5/.
Figure 6.
Figure 6.
Genes of wall assembly and rearrangement. A, The Expansin gene family. This family comprises two major groups, the α-expansins and β-expansins, and two minor groups, the α-like and β-like expansins (Sampedro and Cosgrove, 2005). The grasses have high numbers of α- and β-expansin genes in all groups, but Arabidopsis has a disproportionately high number of α-expansins. The crystal structure of one expansin, the β-expansin EXPB1 (Zea m1), a maize group 1 pollen allergen, has been solved (Yennawar et al., 2006). Color scheme and dendrogram labeling are as described in the legend of Figure 1. See http://cellwall.genomics.purdue.edu/families/4-1-1/ for accession numbers of all genes in this family. B, The XTH gene family. Three major groups of XTH genes have been identified, but transferase and/or hydrolase activities have not been systematically defined. Mutants with defects in XTH24 (meri5; Verica and Medford, 1997), XTH22 (tch4; Xu et al., 1995), and XTH28 (formerly XTR2; Akamatsu et al., 1999) all result in altered growth responses. Even though xyloglucan is a specific substrate, the xyloglucan-poor grasses have nearly equal representation in all three major groups. For accession numbers of all genes in this family, see http://cellwall.genomics.purdue.edu/families/4-2/.
Figure 7.
Figure 7.
Genes of pectin modification. A, The PGase gene family. The polygalacturonan hydrolase gene family in Arabidopsis comprises three groups based on protein structure, which can be further divided into subgroups (Kim et al., 2006; González-Carranza et al., 2007). Inclusion of maize and rice sequences defines a new group H with grass-only sequences. A mutation in a member of group A causes failure of separation of pollen tetrads (quartet3 [qrt3]; Rhee et al., 2003). See http://cellwall.genomics.purdue.edu/families/4-3-3/ for accession numbers of all genes in this family. B, The PME gene family. The original Arabidopsis gene family comprises five major groups (Louvet et al., 2006), of which groups C, D, and E are enriched in Arabidopsis sequences. The mutation qrt1 also results in a pollen cell-separation phenotype similar to qrt3 (Francis et al., 2006). For accession numbers of all genes in this family, see http://cellwall.genomics.purdue.edu/families/4-5-1/. Color scheme and dendrogram labeling are as described in the legend of Figure 1.
Figure 8.
Figure 8.
Expression profiles of cell wall genes in developing maize ovaries. Maize cell wall genes were classified by function according to pathway and/or gene family (the latter as defined in Figs. 1–7; Supplemental Figs. S1–S3). Relative transcript abundance within each class was quantified by the frequency of 3′ UTR-anchored cDNA sequences (number of reads) from each transcript in the data set of Eveland et al. (2008). The sequence counts for each transcript are plotted on a log scale (note range in abundance). Transcripts are labeled with their ZM2G maize sequence identifiers (maizesequence.org). The groups shown include two major biosynthetic processes, nucleotide sugar interconversion (1.1) and phenylpropanoid biosynthesis (1.3), and five large gene families, xyloglucan endotransglucosylase/hydrolases (4.2), expansins (4.1.1), GT8 (2.3.1), GT47 (2.3.2), and GT31 (2.3.5). See Supplemental Table S1 for mRNAs of cell wall genes not shown here.
Figure 9.
Figure 9.
Example of results obtained during a reverse-genetics screen for Mu inserts in CslA7 using the UniformMu DNA grids. In this instance, no phenotype was detected, but visible features appear in other mutants (e.g. cslD5 in Fig. 10). A, Top panels show PCR products obtained from a screen of x and y axes from a given DNA grid. A total of 48 lanes appear in double rows on each panel, and each lane represents a pooled fraction of DNA from 48 families (one to two plants each). Collectively, 2,304 families are screened in each grid. Bottom panels localize a gene-specific Mu insert to a grid coordinate of x34, y41 via hybridization to a gene-specific 32P-labeled probe. B, Nested primers are used to amplify a selected Mu flank for sequence validation using a combination of gene-specific and Mu-specific primers. Here, forward primers FA and FB are used for CslA7, in respective combination with the TIR sequences TIR6 and TIR8, characteristic of Mus. The process progresses from the original plant DNA (black line), to the initial PCR product (striped line), and then to the final product (white line) used for sequencing. Confirmation of a Mu insert is followed by field and greenhouse tests for heritability and possible phenotypic features.
Figure 10.
Figure 10.
Phenotype of a Mu insertion in CslD5. A, Seedlings are root hair deficient. B, Both Mu and Ac inserts near the 5′ end of the CslD5 gene confer a similar phenotype. C to E, Progressive magnification of wild-type (WT) and cslD5 mutant roots reveals the extent of surface differences. Note that although the cslD5 roots appear hairless, they retain a capacity to initiate, but not necessarily elongate, hairs (note hair initials in E.). [See online article for color version of this figure.]
Figure 11.
Figure 11.
Classification of maize mutants nir23 (A, C, and E) and nir27 (B, D, and F) based on NIR spectra. A and B, Baseline-corrected and area-normalized NIR spectra for the mutant (red) and wild-type control (W22; blue). C and D, Digital subtractions (mutant – wild type) of the spectra shown in A and B, respectively. E and F, PCA score plots showing how the mutant and wild-type leaf samples can be distinguished from each other based on their spectral characteristics. The insets show the percentage of correctly classified samples using a multivariate model with increasing numbers of PCs. In both mutants, a model based on the first three PCs results in 100% correct classification. NIR spectra and their digital subtractions from W22 for all 39 nir mutants can be found at http://cellwall.genomics.purdue.edu/families/7/. [See online article for color version of this figure.]
Figure 12.
Figure 12.
Characterization of mutants nir23 (A, C, and E) and nir27 (B, D, and F) based on PyMBMS analysis. A and B, Mass spectra of the wild type (top) and mutant (bottom; mirror image) in the m/z 50 to 450 range. The spectra were normalized to total ion current. C and D, PCA score plots showing how the mutant and wild-type leaf samples can be distinguished from each other based on their mass spectra. The insets show the percentage of correctly classified samples with increasing numbers of PCs. E and F, Loadings of the two PCs represented in score plots C and D, respectively, with a set of diagnostic ions marked. Diagnostic masses for known carbohydrate and aromatic fragments are provided in Supplemental Table S3. Populations of samples of mutant and W22 (wild type) are classified correctly on the basis of five PCs, accounting for over 90% of the correct classification for both mutants. Loadings of PC1 to PC3 indicate that the cell walls of the mutant have a higher carbohydrate-to-lignin ratio in the mutant, as evidenced by the following ions in PC1 of m/z 55, 73, 85, and 98 diagnostic of carbohydrate, m/z 114 specifically from pentoses, and m/z 126 specifically from hexoses, whereas the other peaks represent either hexoses or pentoses. Based on the presence of m/z 150 in PC1, the cell walls of mutant nir27 contain more ferulic acid. High PC1 translates to less phenolic compounds, including negative values for mass fragments from phenol (m/z 94) and G- and S-lignin derivatives from lignin, such as guaiacyl (m/z 124), 4-vinylphenol (m/z 120), ethylguaiacyl (m/z 137), syringol (m/z 154), isomers of eugenol (m/z 164), and coniferaldehyde (m/z 178). [See online article for color version of this figure.]

Similar articles

Cited by

References

    1. Ahn JW, Verma R, Kim M, Lee JY, Kim YK, Bang JW, Reiter WD, Pal HS (2006) Depletion of UDP-D-apiose/UDP-D-xylose synthases results in rhamnogalacturonan II deficiency, cell wall thickening, and cell death in higher plants. J Biol Chem 281 13708–13716 - PubMed
    1. Akamatsu T, Hanzawa Y, Ohtake Y, Takahashi T, Nishitani K, Komeda Y (1999) Expression of endoxyloglucan transferase genes in acualis mutants of Arabidopsis. Plant Physiol 121 715–721 - PMC - PubMed
    1. Alonso JM, Stepanova AN, Leisse TJ, Kim CJ, Chen H, Shinn P, Stevenson DK, Zimmerman J, Barajas P, Cheuk R, et al (2003) Genome-wide insertional mutagenesis of Arabidopsis thaliana. Science 301 653–657 - PubMed
    1. Altschul SF, Gish W, Miller W, Myers EW, Lipman DJ (1990) Basic local alignment search tool. J Mol Biol 215 403–410 - PubMed
    1. Appenzeller L, Doblin M, Barreiro R, Wang HY, Niu XM, Kollipara K, Carrigan L, Tomes D, Chapman M, Dhugga KS (2004) Cellulose synthesis in maize: isolation and expression analysis of the cellulose synthase (CesA) gene family. Cellulose 11 287–299

Publication types

MeSH terms

LinkOut - more resources