. 2010 Feb;298(2):G314-21.
doi: 10.1152/ajpgi.00389.2009. Epub 2009 Nov 19.

High-resolution entrainment mapping of gastric pacing: a new analytical tool

Affiliations

High-resolution entrainment mapping of gastric pacing: a new analytical tool

Gregory O'Grady et al. Am J Physiol Gastrointest Liver Physiol. 2010 Feb.

Abstract

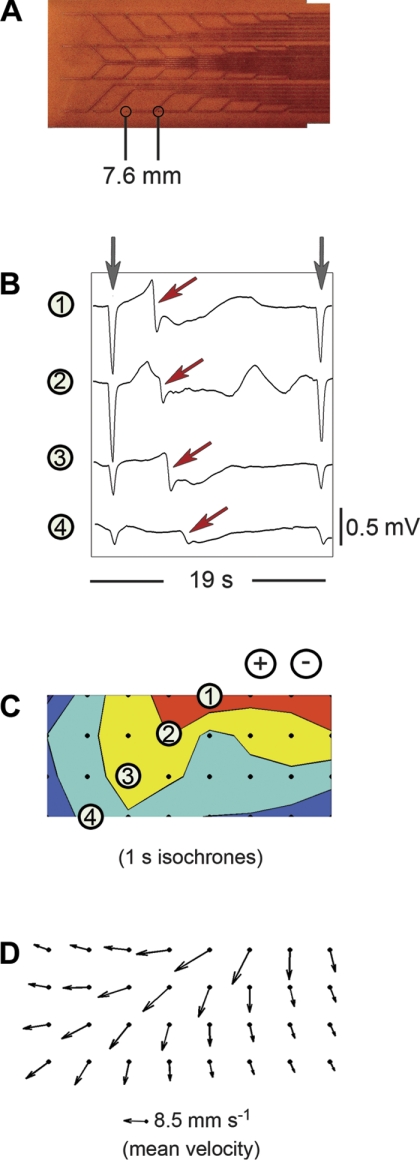
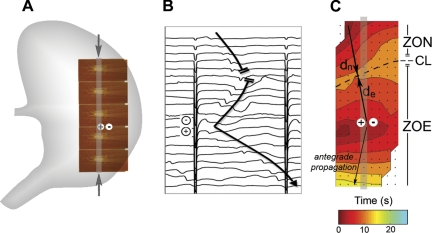
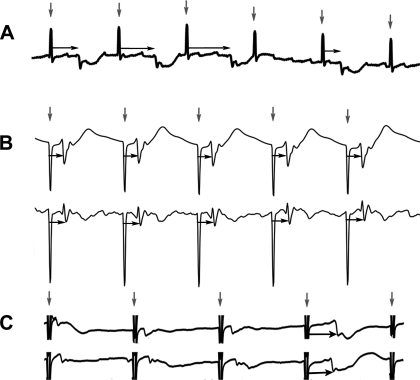
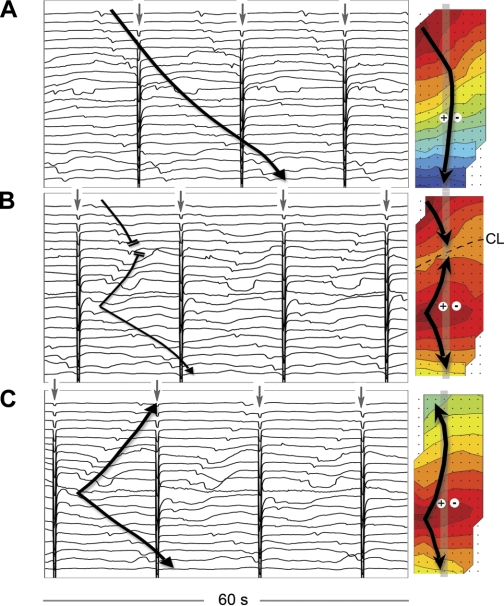
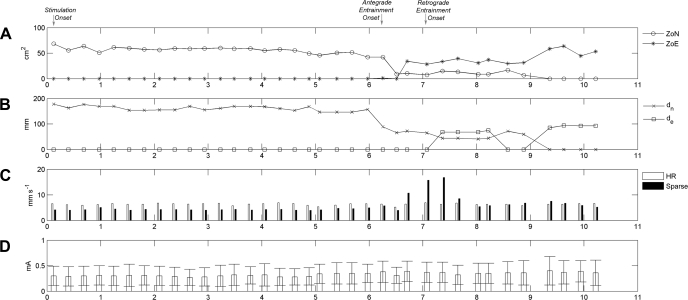
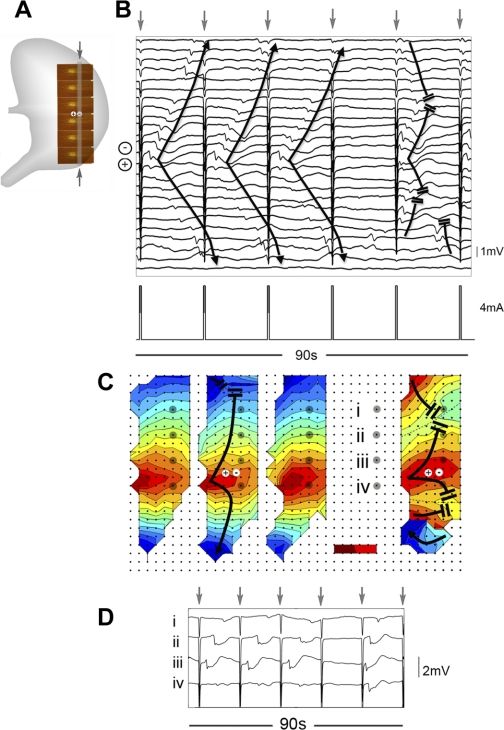
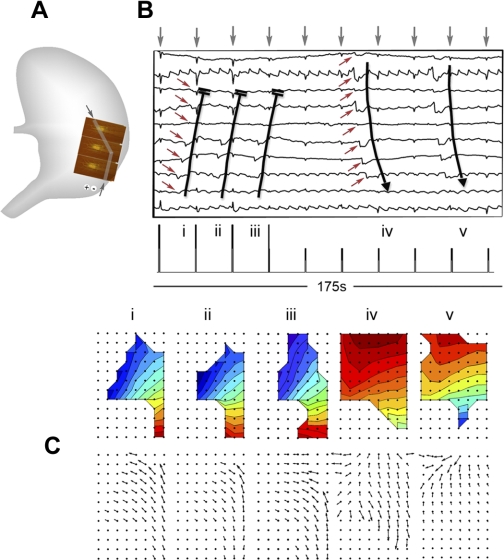
Gastric pacing has been investigated as a potential treatment for gastroparesis. New pacing protocols are required to improve symptom and motility outcomes; however, research progress has been constrained by a limited understanding of the effects of electrical stimulation on slow-wave activity. This study introduces high-resolution (HR) "entrainment mapping" for the analysis of gastric pacing and presents four demonstrations. Gastric pacing was initiated in a porcine model (typical amplitude 4 mA, pulse width 400 ms, period 17 s). Entrainment mapping was performed using flexible multielectrode arrays (</=192 electrodes; 92 cm(2)) and was analyzed using novel software methods. In the first demonstration, entrainment onset was quantified over successive waves in spatiotemporal detail. In the second demonstration, slow-wave velocity was accurately determined with HR field analysis, and paced propagation was found to be anisotropic (longitudinal 2.6 +/- 1.7 vs. circumferential 4.5 +/- 0.6 mm/s; P < 0.001). In the third demonstration, a dysrhythmic episode that occurred during pacing was mapped in HR, revealing an ectopic slow-wave focus and uncoupled propagations. In the fourth demonstration, differences were observed between paced and native slow-wave amplitudes (0.24 +/- 0.08 vs. 0.38 +/- 0.14 mV; P < 0.001), velocities (6.2 +/- 2.8 vs. 11.5 +/- 4.7 mm/s; P < 0.001), and activated areas (20.6 +/- 1.9 vs. 32.8 +/- 2.6 cm(2); P < 0.001). Entrainment mapping enables an accurate quantification of the effects of gastric pacing on slow-wave activity, offering an improved method to assess whether pacing protocols are likely to achieve physiologically and clinically useful outcomes.


Figures

Fig. 1.
Fig. 1.
Methods for entrainment mapping. A: flexible printed circuit board (PCB) electrodes, each containing 32 electrodes (4 × 8 configuration; interelectrode distance 7.6 mm). B: sample gastric electrograms recorded using the PCBs during pacing. The gray arrows indicate stimulus artifacts, and the red arrows indicate slow waves. C: an isochronal activation map of a single entrained slow wave. The black dots represent the high-resolution (HR) electrode configuration, and the four numbered electrodes correspond to the electrograms shown in B. Each color band between the isochrone lines indicates the area of slow-wave propagation over each 1-s interval. The stimulus location was above the recorded area (+/−). D: velocity field map of the same event. The arrows indicate the direction and velocity of the slow wave at each electrode. The mean velocity is 8.5 ± 3.1 mm/s over this mapped field.
Fig. 2.
Fig. 2.
Methods for describing entrainment efficacy and interactions. A: pacing was conducted at a midcorpus site (+/−) (period 17 s, pulse width 400 ms, amplitude 4 mA). HR mapping was performed using 5 tessellated PCBs (160 electrodes; 77 cm2). B: representative electrograms recorded from the column of electrodes indicated by the gray bands and arrows in A. Induced slow waves propagated away from the stimulus site (+/−) and collided with the antegrade native activity (upper 5 channels). C: entrainment map for this same sequence; each color band indicates the area of slow-wave propagation over each 2-s interval. The zone of native activity (ZON) indicates the area where the native slow wave propagated within the mapped field (21.5 cm2). The zone of entrainment (ZOE) indicates the area that was entrained by pacing within the mapped field (51.7 cm2). The “collision line” (CL) denotes where the ZON and ZOE meet. Another line is drawn from the pacing site to the first electrode activated by native activity, and dn indicates the distance that the native slow wave propagated along this line (4.6 cm), whereas de indicates the distance that the entrained slow wave propagated in the retrograde direction along this line (4.3 cm).
Fig. 3.
Fig. 3.
Determining entrainment onset with sparse electrodes. In sparse-electrode studies, the temporal relationship between the pacing artifacts (vertical arrows) and the slow waves is often used to determine the onset of entrainment. A: an irregular period between artifact and slow wave (horizontal arrows) indicates no slow-wave entrainment. B: regular period between the artifacts and slow waves (horizontal arrows) indicates entrainment (phase-locking). C: if the native slow-wave and pacing frequencies were similar, then it would be unclear whether entrainment was achieved or not, as in the first 3 waves shown here (all occurring at 3.5 counts/min). In this case, the last wave in each electrogram is the true time of entrainment onset (horizontal arrows).
Fig. 4.
Fig. 4.
Entrainment mapping after the onset of gastric pacing. Gastric pacing was conducted at a period of 17 s (3.5 counts/min), amplitude of 4 mA, and pulse width of 400 ms using electrodes positioned as shown in Fig. 2A. Three 60-s electrogram sequences are presented from recordings taken after pacing onset, and activation maps are shown for each cycle that is designated by the black arrows. The displayed electrograms correspond to the vertical columns of channels indicated by the vertical gray bands on each map. Stimulus artifacts are signaled with gray arrows. The isochronal intervals are 2 s. A: t = 0–60 s after pacing onset. Normal antegrade slow-wave propagation (3.5 ± 0.1 counts/min) initially continued unchanged. B: t = 405–465 s. The entrained area gradually expanded to overtake the native activity. For the mapped event, the ZON = 21.5 cm2, ZOE = 51.7 cm2, dn = 4.6 cm, and de = 4.3 cm. C: t = 575–635 s. Total entrainment of the mapped field was achieved over multiple successive waves.
Fig. 5.
Fig. 5.
Quantification of slow-wave entrainment. A: ZON and ZOE are quantified during the onset of entrainment for the same experiment detailed in Fig. 4. Entrainment onset is indicated by a fall in the ZON and expansion of the ZOE. B: plot of dn and de measured for every cycle over the same period. Entrainment onset is indicated by a fall in dn. C: propagation velocities as determined with the sparse electrodes and the HR mapping. Before the onset of entrainment, the velocity calculated by a sparse-electrode method was consistently slower than the velocity calculated by the HR velocity method (6.3 ± 2.8 mm/s vs. 4.3 ± 1.8 mm/s; P < 0.001). During the onset of entrainment (6.8–7.5 min) the sparse-electrode method was found to markedly overestimate the slow-wave velocity. D: slow-wave amplitude after entrainment was slightly higher than the baseline amplitude (0.31 ± 0.19 vs. 0.36 ± 0.22 mA; P < 0.001).
Fig. 6.
Fig. 6.
Dysrhythmia during gastric pacing. A: entrainment mapping was performed with 192 electrodes (area ∼93 cm2). B: gastric pacing (period 17 s, amplitude 4 mA, pulse width 400 ms) achieved regular entrainment. The displayed electrograms were recorded from the column of electrode channels indicated by the vertical gray band and arrows in A. Three entrained waves are presented, followed by a skipped cycle (no wave was entrained), followed by a dysrhythmic event. C: HR maps of the 3 entrained cycles, one skipped cycle, and a dysrhythmic episode are presented in sequence. The dysrhythmic event is shown to feature, from top of mapped field to bottom: a native wave, an entrained wave (retrograde and antegrade propagation), an ectopic pacemaker, and an uncoupled wavefront propagating medially. D: sparse selection of 4 electrodes is shown over the same recording period (interelectrode spacing 30 mm), from the electrodes (iiv) highlighted with gray circles in C. A sparse electrode analysis would have detected an irregularity in the gastric rhythm but would not have detected the ectopic events and uncoupled propagation.
Fig. 7.
Fig. 7.
Comparison of pacing protocols at HR. A: entrainment mapping was performed with 3 PCBs (92 electrodes; area ∼47 cm2). B: pacing was performed at an antral site (period 19 s, amplitude 4 mA, pulse width 400 ms). The presented electrograms are from the representative channels indicated by the gray bars and arrows in A. Following successful entrainment of the mapped field, the amplitude was halved to 2 mA, resulting in loss of entrainment, indicated by the return of native antegrade propagation, which showed a lower frequency, faster velocity, and higher amplitude than the entrained activity. The mapped events in C correspond to the slow-wave cycles (iv) that are marked on the electrograms. Activation and velocity field maps are shown for each cycle. The retrograde entrained activity activated less of the mapped tissue area than the native activity (20.6 ± 1.9 cm2 vs. 32.8 ± 2.6 cm2; P < 0.001).

References

    1. Bortolotti M. The “electrical way” to cure gastroparesis. Am J Gastroenterol 97: 1874–1883, 2002 - PubMed
    1. Chen JD, Xu X, Zhang J, Abo M, Lin X, McCallum RW, Ross B. Efficiency and efficacy of multi-channel gastric electrical stimulation. Neurogastroenterol Motil 17: 878–882, 2005 - PubMed
    1. Cheng LK, O'Grady G, Du P, Egbuji J, Windsor JA, Pullan AJ. Gastrointestinal system. Wiley Interdiscip Rev Syst Biol Med In press - PMC - PubMed
    1. Du P, Li S, O'Grady G, Cheng LK, Pullan AJ, Chen JDZ. Effects of electrical stimulation on isolated rodent gastric smooth muscle cells evaluated via a joint computational simulation and experimental approach. Am J Physiol Gastrointest Liver Physiol 297: G672–G680, 2009 - PMC - PubMed
    1. Du P, O'Grady G, Egbuji JU, Lammers WJ, Budgett D, Nielsen P, Windsor JA, Pullan AJ, Cheng LK. High-resolution mapping of in vivo gastrointestinal slow wave activity using flexible printed circuit board electrodes: methodology and validation. Ann Biomed Eng 37: 839–846, 2009 - PMC - PubMed

Publication types

LinkOut - more resources