. 2010 Jan 20;29(2):292-303.
doi: 10.1038/emboj.2009.341. Epub 2009 Nov 19.

ArfGAP1 generates an Arf1 gradient on continuous lipid membranes displaying flat and curved regions

Affiliations

ArfGAP1 generates an Arf1 gradient on continuous lipid membranes displaying flat and curved regions

Ernesto Ambroggio et al. EMBO J. .

Abstract

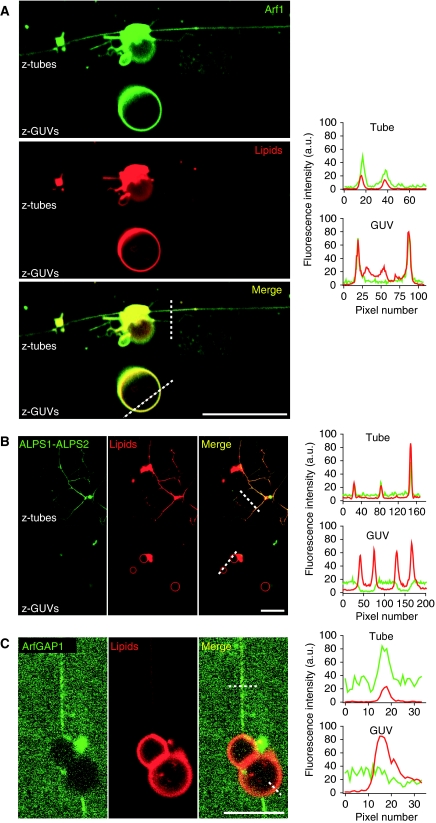
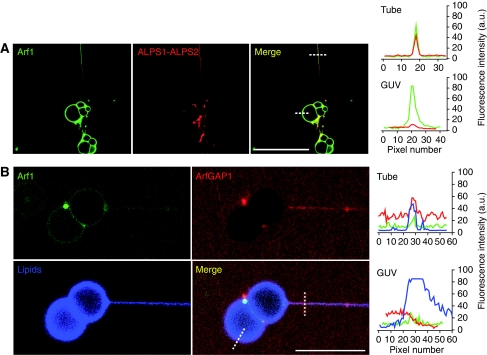
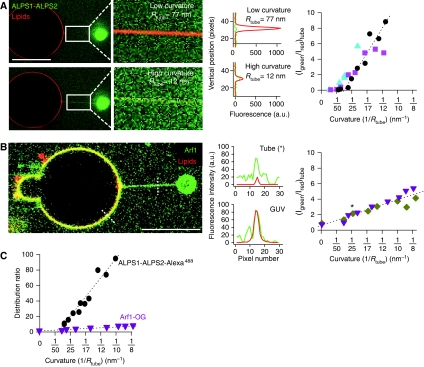
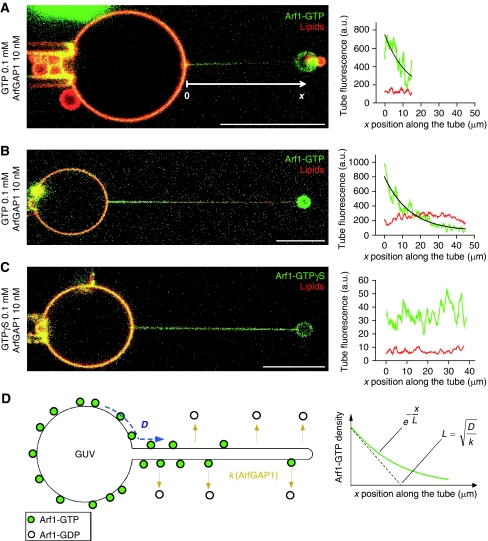
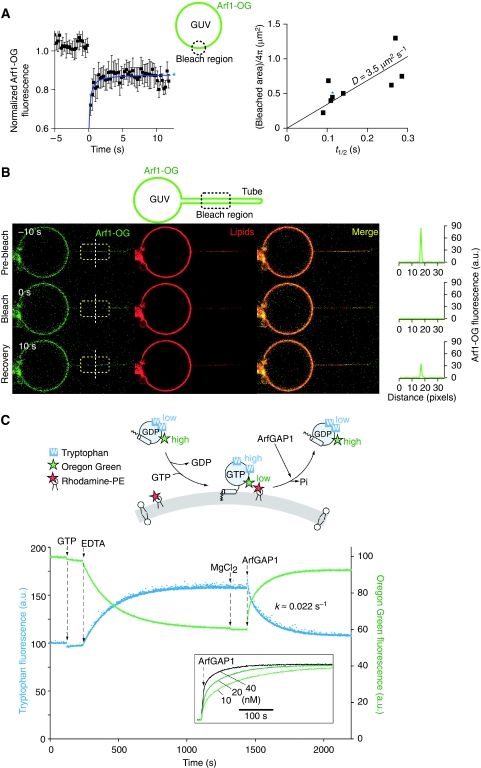
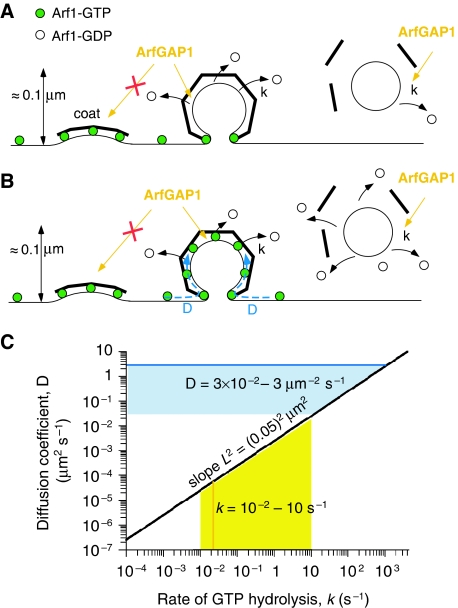
ArfGAP1, which promotes GTP hydrolysis on the small G protein Arf1 on Golgi membranes, interacts preferentially with positively curved membranes through its amphipathic lipid packing sensor (ALPS) motifs. This should influence the distribution of Arf1-GTP when flat and curved regions coexist on a continuous membrane, notably during COPI vesicle budding. To test this, we pulled tubes from giant vesicles using molecular motors or optical tweezers. Arf1-GTP distributed on the giant vesicles and on the tubes, whereas ArfGAP1 bound exclusively to the tubes. Decreasing the tube radius revealed a threshold of R approximately 35 nm for the binding of ArfGAP1 ALPS motifs. Mixing catalytic amounts of ArfGAP1 with Arf1-GTP induced a smooth Arf1 gradient along the tube. This reflects that Arf1 molecules leaving the tube on GTP hydrolysis are replaced by new Arf1-GTP molecules diffusing from the giant vesicle. The characteristic length of the gradient is two orders of magnitude larger than a COPI bud, suggesting that Arf1-GTP diffusion can readily compensate for the localized loss of Arf1 during budding and contribute to the stability of the coat until fission.


Conflict of interest statement

The authors declare that they have no conflict of interest.

Figures

Figure 1
Figure 1
ArfGAP1 and its ALPS1-ALPS2 region bind specifically to curved membranes, whereas Arf1-GTP shows only a slight preference for curved regions. Membrane tube networks were pulled from GUVs containing DOPC (98%), a red fluorescent lipid (BodTRCer, 1%) and a biotinylated lipid (BiotPE, 1%) by the truncated biotinylated version of kinesin 1. Tube networks (red panel) were incubated with 0.5 μM Arf1-OG in the presence of GTP (A), 0.5 μM, ALPS1-ALPS2-Alexa488 (B) or 1 μM ArfGAP1 labelled with a primary antibody against ArfGAP1 (rabbit) and a secondary green fluorescent (Alexa488) anti-rabbit antibody (C). Fluorescence intensity profiles in the tube (‘z-tubes' in the confocal images on the left panels) and in the GUV (‘z-GUVs') regions across the dashed lines are plotted on the right panels (green line: protein fluorescence; red line: lipid marker fluorescence). Scale bar: 15 μm.
Figure 2
Figure 2
Membrane-bound Arf1-GTP does not alter the ability of ALPS and ArfGAP1 to interact specifically with curved membranes. Kinesin-pulled tube networks were first incubated with 0.5 μM Arf1-OG+GTP (green). Then 3 μM ALPS1-ALPS2-Alexa546 (A) or 3 μM antibody-labelled ArfGAP1 (B) was injected (red). The lipid marker SQUARE-685-PC is shown in (B) (blue channel). Fluorescence intensity profiles in the tube and GUV regions across the dashed lines are plotted on the right panels (green line: Arf1-OG fluorescence; red line: ALPS1-ALPS2-Alexa546 fluorescence in (A) or Cy3 antibody-labelled ArfGAP1 in (B); blue line: lipid marker fluorescence). Scale bar: 15 μm.
Figure 3
Figure 3
A curvature threshold for the binding of the ALPS1-ALPS2 region of ArfGAP1 to membrane tubes. (A) A single membrane tube was pulled with optical tweezers from a DOPC GUV containing the fluorescent lipid marker BodTRCer (red) in the presence of 0.9 μM ALPS1-ALPS2-Alexa488 (green). The micropipette used to manipulate the GUV and to control membrane tension is on the left of the image (not shown). The bead appears in green on the right. Zooms of the tube region at low and high curvatures as well as the corresponding fluorescence intensity profiles for ALPS1-ALPS2-Alexa488 (green line) and BodTRCer (red line) across the tube are shown. The red signal from the lipid marker is weak at high curvature because of thinning of the tube. The right panel shows the ratio between ALPS1-ALPS2-Alexa488 fluorescence (IGreen) and the lipid marker fluorescence (IRed) as a function of tube curvature (1/Rtube) from three representative experiments performed with different GUVs. The intersection between the dotted line and the x axis gives the critical curvature radius for ALPS1-ALPS2 binding (36±5 nm). (B) Same as in (A) except that ALPS1-ALPS2-Alexa488 was replaced by 0.5 μM Arf1-OG, which was converted to the GTP-bound conformation in the presence of the GUV before the formation of the tube (two independent experiments). The data point indicated by an asterisk corresponds to fluorescence ratio in the tube shown in the left image. The point at zero curvature corresponds to the fluorescence ratio on the GUV. (C) To compare the data shown (A, B), the fluorescence ratio in the tube was normalized to that in the GUV to get the distribution ratio, which is independent on the experimental conditions (labelling, gain and photobleaching). For this purpose, the ALPS1-ALPS2-Alexa488 fluorescence on the GUV was considered to be equal to the background noise. The effect of membrane curvature on the distribution ratio of ALPS1-ALPS2-Alexa488 is thus underestimated. Scale bar: 15 μm.
Figure 4
Figure 4
Arf1 gradients induced by ArfGAP1-catalysed GTP hydrolysis on membrane tubes pulled from GUVs. (AC) A membrane tube was pulled with optical tweezers from a GUV pre-incubated with Arf1-OG and GTP or the non-hydrolysable analogue GTPγS in the presence of 10 nM ArfGAP1. Tube radius: 10 nm (A, C) or 15 nm (B). The fluorescence intensities of Arf1-OG (green) and the lipid marker (red) along the tube are plotted on the right panels. In (A, B), Arf1-OG fluorescence intensity was fitted by an exponential decay (black curve). (D) Schematic view of the diffusion–reaction model. GTP hydrolysis on Arf1 occurs exclusively on the tube because of specific binding of ArfGAP1 to this region. New Arf1-GTP molecules diffusing from the GUV replace those that dissociate from the tube on GTP hydrolysis. As a result, an Arf1-GTP gradient forms. The characteristic length (L) of the gradient reflects the balance between diffusion (D) and GTP hydrolysis (k). Scale bar: 15 μm.
Figure 5
Figure 5
Diffusion coefficient of Arf1-OG and rate constant of ArfGAP1-catalysed GTP hydrolysis on model DOPC membranes. (A) Left: typical FRAP curve for GTP-bound Arf1-OG on a DOPC giant vesicle. Right: correlation between the half time of recovery (t1/2) and the bleached area (πR2). The diffusion coefficient is given by D=R2/(4t1/2). (B) FRAP experiment showing the fast mobility of GTP-bound Arf1-OG on a DOPC tube pulled by optical tweezers. The length of the photobleached area is 12 μm. (C) Top: cartoon representation of the fluorescence signals used to follow either the conformational changes of Arf1-OG on nucleotide exchange and GTP hydrolysis or its binding to and dissociation from small DOPC liposomes. Bottom: Arf1-OG (0.5 μM) was mixed with DOPC small liposomes (0.4 mM; hydrodynamic radius=40±10 nm) containing 1 mol% Rhodamine-PE. At the indicated times, GTP (40 μM), EDTA (2 mM), MgCl2 (2 mM) and ArfGAP1 (10 nM) were added. Tryptophan fluorescence (blue trace) or Oregon Green fluorescence (green trace) was followed in real time. Note the good time correlation between the two recordings. The inset shows the time course of Arf1-OG dissociation as monitored by Oregon Green fluorescence using increasing concentrations of ArfGAP1.
Figure 6
Figure 6
Implications of the diffusion–reaction model for the stability of the COPI coat during budding. (A) With no lateral diffusion of Arf1 a mature COPI-coated bud should have lost most of its Arf1-GTP molecules through the action of ArfGAP1, which acts in regions of high positive curvature. This could compromise coat stability. (B) Alternatively, new Arf1-GTP molecules diffusing from the Golgi cisternae could constantly replace those that are leaving the bud on GTP hydrolysis, thereby stabilizing the coat. Once membrane fission occurs, the flux of Arf1-GTP necessarily stops and GTP hydrolysis on Arf1 leads to coat disassembly from the vesicle. (C) The black line of the plot reports pair values of k and D that leads to an Arf1 gradient with a characteristic length L=50 nm. The bold coloured lines indicate the values of k and D given by the experiments shown in Figure 5. The yellow area shows the range of reported values for the rate constant (k) of GTP hydrolysis on Arf1 catalysed by ArfGAP1. The blue area describes the range of D-values that would prevent the formation a sharp Arf1-GTP gradient in a curved region of the size of a COPI-coated bud when this region is connected to a flat membrane serving as a reservoir of Arf1-GTP.

References

    1. Ahmadian MR, Hoffmann U, Goody RS, Wittinghofer A (1997) Individual rate constants for the interaction of Ras proteins with GTPase-activating proteins determined by fluorescence spectroscopy. Biochemistry 36: 4535–4541 - PubMed
    1. Angelova M, Soléau S, Méléard P, Faucon F, Bothorel P (1992) Preparation of giant vesicles by external AC electric fields. Kinetics and applications. In Trends in Colloid and Interface Science VI, C Helm, M Lösche, H Möhwald (eds), pp 127–131. Steinkopff Verlag-Darmstadt, Springer-Verlag-New York: Springer Berlin/Heidelberg
    1. Antonny B, Beraud-Dufour S, Chardin P, Chabre M (1997) N-terminal hydrophobic residues of the G-protein ADP-ribosylation factor-1 insert into membrane phospholipids upon GDP to GTP exchange. Biochemistry 36: 4675–4684 - PubMed
    1. Beck R, Sun Z, Adolf F, Rutz C, Bassler J, Wild K, Sinning I, Hurt E, Brugger B, Bethune J et al. . (2008) Membrane curvature induced by Arf1-GTP is essential for vesicle formation. Proc Natl Acad Sci USA 105: 11731–11736 - PMC - PubMed
    1. Bigay J, Gounon P, Robineau S, Antonny B (2003) Lipid packing sensed by ArfGAP1 couples COPI coat disassembly to membrane bilayer curvature. Nature 426: 563–566 - PubMed

Publication types

MeSH terms