. 2009 Dec 16;28(24):3785-98.
doi: 10.1038/emboj.2009.340.

Molecular crowding affects diffusion and binding of nuclear proteins in heterochromatin and reveals the fractal organization of chromatin

Affiliations

Molecular crowding affects diffusion and binding of nuclear proteins in heterochromatin and reveals the fractal organization of chromatin

Aurélien Bancaud et al. EMBO J. .

Abstract

The nucleus of eukaryotes is organized into functional compartments, the two most prominent being heterochromatin and nucleoli. These structures are highly enriched in DNA, proteins or RNA, and thus thought to be crowded. In vitro, molecular crowding induces volume exclusion, hinders diffusion and enhances association, but whether these effects are relevant in vivo remains unclear. Here, we establish that volume exclusion and diffusive hindrance occur in dense nuclear compartments by probing the diffusive behaviour of inert fluorescent tracers in living cells. We also demonstrate that chromatin-interacting proteins remain transiently trapped in heterochromatin due to crowding induced enhanced affinity. The kinetic signatures of these crowding consequences allow us to derive a fractal model of chromatin organization, which explains why the dynamics of soluble nuclear proteins are affected independently of their size. This model further shows that the fractal architecture differs between heterochromatin and euchromatin, and predicts that chromatin proteins use different target-search strategies in the two compartments. We propose that fractal crowding is a fundamental principle of nuclear organization, particularly of heterochromatin maintenance.


Conflict of interest statement

The authors declare that they have no conflict of interest.

Figures

Figure 1
Figure 1
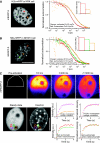
Steady state and induced volume exclusion in heterochromatin and nucleoli. (A) NRK cells were co-injected with 25 and 500 kDa fluorescently labelled dextrans. The right panel shows nucleolar versus nucleoplasmic relative exclusion of four different inert probes in NRK. (B) NIH3T3 cells were co-injected with 25 and 500 kDa fluorescently labelled dextrans, and stained with Hoechst to identify euchromatin or heterochromatin foci. It should be noted that heterochromatin concentration variations are amplified using Hoechst because of its sequence preference for AT-rich regions. Insets are two-fold magnified, pseudocoloured images of a heterochromatin focus. The green arrowhead indicates a heterochromatin focus, in which the DNA density is six-fold enriched in comparison with euchromatin. The relative concentration of dextrans in heterochromatin versus euchromatin was evaluated as a function of the local amount of heterochromatin in the confocal section. In the right plot, ‘effective' exclusions in heterochromatin foci of density 6 (see Supplementary Figure S1 for details) are plotted for five probes of different molecular weights. (C) NRK cells expressing mRFP-2 alone or co-expressing Suv39H1–GFP were stained with Hoechst. Blue and purple arrowheads indicate exemplary heterochromatin foci in which mRFP-2 exclusion can be detected. On the right, the Hoechst channel is thresholded with pixels in the range 0–49, 50–134 and 134–255 represented in black, red and green, respectively.
Figure 2
Figure 2
The nuclear rheology is heterogeneous. (A) NRK cell transiently expressing H2b-mRFP and mEGFP-5 were subjected to FCS measurements. Crosses on the H2b image indicate positions at which measurements were performed. The graph shows normalized auto correlation functions (ACF) obtained in the nucleoplasm (red) and the nucleolus (orange). Fits were performed with an anomalous diffusion model (solid curves), and we deduced residence times of 1050 and 3650 μs, and anomalous coefficients of 0.78 and 0.65 in nucleoplasm and nucleolus, respectively. The inset shows count rates, that is, intensities measured by FCS in the nucleoplasm (red) and nucleolus (orange). (B) Similar experiments performed with NIH3T3 cells. The green cross indicates the position of heterochromatin measurements, which was always quality controlled taking advantage of H2B–mRFP bleaching during FCS (Supplementary Figure S2). Graphs show normalized ACFs obtained in euchromatin (red), heterochromatin (green) and nucleoli (orange). Fits (solid curves) show more pronounced diffusion slow down in nucleoli than in heterochromatin, as inferred from the mEGFP-5 residence times of 3570 μs (α=0.70) and 1410 μs (α=0.80) in nucleoli and heterochromatin, respectively, in comparison to 790 μs (α=0.77) in euchromatin (bottom). Inset shows count rates measured in euchromatin (red), heterochromatin (green) and nucleoli (orange). (C) Selected frames of mPAGFP-2 half-nucleus PA time lapse imaging with the photoactivated region represented by the polygon on the pre-activation image. To visualize entry kinetics within nuclear compartments, 1.2-μm confocal slices were grabbed. High-quality images of mPAGFP-2 steady state and Hoechst distribution were acquired 60 s after PA (lower panel). Rings on the steady-state image correspond to regions in which the intensity redistribution was measured over time. Graphs at the left compare nucleolar (orange) and heterochromatin (green) fluorescence intensity measured over time in the regions highlighted with the corresponding coloured circles in the steady-state image to the intensity in a neighbouring nucleoplasmic area (red and purple regions). Graphs at the right display the same curves after steady-state renormalization. Scale bars 10 μm.
Figure 3
Figure 3
Binding of chromatin-interacting proteins is enhanced in heterochromatin. (A) Pseudocoloured images of NIH3T3 cells transiently expressing H1.1–mPAGFP, RCC1–mPAGFP and H1t–PAGFP. Images are selected frames of PA time lapse with the photoactivated region represented by circles in euchromatin (red) or in heterochromatin (green) on the pre-activation image. The inserts outlined in red and green correspond to two higher magnifications of photoactivated areas in euchromatin and heterochromatin, respectively. Two lookup tables associated to heterochromatin PA and nuclei, or to euchromatin PA are defined in the middle and lower panel, respectively. Experiments with RCC1–mPAGFP and H1t–mPAGFP were carried out at 26°C. Confocal section thickness values were set to 1.0 μm, that is, three times less than the photoactivated spot size. Scale bar 10 μm. (B) Graphs representing normalized intensities measured during relaxation in the circled regions of the experiment displayed in (A) (red: euchromatin, green: heterochromatin). Euchromatin responses are accurately fitted with a diffusion limited model (see Materials and methods section, lower solid line), but this model fails to reproduce heterochromatin response curves (upper solid lines) especially at short time scales, showing that chromatin protein dynamics are associated with a longer residence in heterochromatin right after PA. Insets represent average early time points responses measured in euchromatin and heterochromatin (red and green data sets, respectively) to emphasize on the initial plateau in heterochromatin.
Figure 4
Figure 4
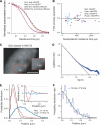
Chromatin shows a fractal organization at length scales ⩽∼100 nm. (A) Average FCS response of mEGFP in bulk (pink crosses) fitted with a standard diffusion model (α=1 in equation (7)), and in the nucleoplasm (red circles) fitted with an anomalous sub-diffusive model (α=0.79, dashed line) or a standard diffusion model (solid line). (B) FCS behaviours of mEGFP (red), mEGFP-2 (cyan), mEGFP-5 (green) and mEGFP-10 (purple) multimers were probed in the nucleoplasm of NRK cells. As GFP decamers and to a lesser degree GFP pentamers were partially degraded in cells (Supplementary Figure S5), we used the residence time in the FCS volume to report their molecular weight. On the basis of anomalous sub-diffusion fits, anomalous parameters are plotted versus nucleoplasmic residence times that are assumed to be proportional to mEGFP multimers MW. (C) NIH3T3 cells were micro-injected with QDs. The inset shows the trajectory of one QD aggregate obtained from a time series acquired every 1.9 ms. Scale bar 5 μm. (D) Plot of log(MSD/(D × Δt)) versus log(Δt) averaged over 16 tracks (blue crosses), and linear fit at short time scales (black line), slope of which (γ=0.73 in equation (3)) shows the anomalous subdiffusive motion of QDs. The plateau at long time scales corresponds to a standard diffusive behaviour. (E) Histograms of the displacement at 1.9 ms (red) and 30.4 ms (cyan) obtained with 15 independent tracks (∼14 000 points), and their corresponding fits based on a random walk model (equation 5). In the inset, residuals show the Brownian response at 30.4 ms (cyan), and the deviation to this behaviour at 1.9 ms (red). The discrepancy to the Brownian model at 1.9 ms was neither observed in control experiments performed in free solution nor with QDs bound to chromatin (Supplementary Figure S5), and we show in Figure S5g that this anomalous behaviour cannot be explained by QDs transiently binding to chromatin. (F) The blue plot shows the ratio of displacement histograms at 1.9 ms versus 7.8 ms for one QD trajectory (blue data set). The solid curve corresponds to the fit obtained with the stretched exponential model (see equation (6) in Materials and methods section). Its amplitude is related to fractal dimension of chromatin, and we measure f=2.5 given that γ=0.73. It should be noted that f=3.0 in the case of free diffusion (Supplementary Figure S5).
Figure 5
Figure 5
Fractal kinetics occur in heterochromatin. (A) Plots of the same H1.1, RCC1 and H1t redistributions as in Figure 3C (red and green data sets correspond to euchromatin and heterochromatin, respectively). The initial plateau can be fitted using a fractal kinetics model (upper cyan curves) with fractal exponents of 0.13, 0.39 and 0.21 for H1.1, RCC1 and H1t, respectively. Fractal exponents seemed to be lower than 0.01 in euchromatin (lower cyan curves). Insets represent average early time-point responses measured in euchromatin and heterochromatin (red and green data sets, respectively) and their corresponding fits with a fractal model (cyan curves). (B) 2D representation of fractal structures with two different fractal dimensions. The upper picture corresponds to a percolation cluster with f=∼1.9, and the lower one to a self-avoiding random walk with f=∼1.3. it should be noted that the upper and lower limits of self-similarity are not represented with relevant scales, and that the fractal dimension is lower than what is due because these representations are in 2D. The accessible space (white surface) and the fractal contour (black boundary) are much larger in the upper picture, as deduced in the case of euchromatin versus heterochromatin. Notably, heterochromatin compact exploration is bound to the high level of confinement in this compartment, which constrains diffusion and favours the systematic visit of its binding sites, as shown with the cartooned purple trajectories of the orange tracer.

Comment in

  • Fractal geometry in the nucleus.
    McNally JG, Mazza D. McNally JG, et al. EMBO J. 2010 Jan 6;29(1):2-3. doi: 10.1038/emboj.2009.375. EMBO J. 2010. PMID: 20051993 Free PMC article. No abstract available.

References

    1. Andersen JS, Lam YW, Leung AK, Ong SE, Lyon CE, Lamond AI, Mann M (2005) Nucleolar proteome dynamics. Nature 433: 77–83 - PubMed
    1. Bancaud A, Conde e Silva N, Barbi M, Wagner G, Allemand JF, Mozziconacci J, Lavelle C, Croquette V, Victor JM, Prunell A, Viovy JL (2006) Structural plasticity of single chromatin fibers revealed by torsional manipulation. Nat Struct Mol Biol 13: 444–450 - PubMed
    1. Beaudouin J, Mora-Bermudez F, Klee T, Daigle N, Ellenberg J (2006) Dissecting the contribution of diffusion and interactions to the mobility of nuclear proteins. Biophys J 90: 1878–1894 - PMC - PubMed
    1. Belmont A (2003) Dynamics of chromatin, proteins, and bodies within the cell nucleus. Curr Opin Cell Biol 15: 304–310 - PubMed
    1. Ben-Avraham S, Havlin S (2000) Diffusion and Reactions in Fractals and Disordered Systems. Cambridge: Cambridge University Press

Publication types