. 2010 Jan 6;29(1):222-35.
doi: 10.1038/emboj.2009.327. Epub 2009 Nov 19.

Combinations of genetic mutations in the adult neural stem cell compartment determine brain tumour phenotypes

Affiliations

Combinations of genetic mutations in the adult neural stem cell compartment determine brain tumour phenotypes

Thomas S Jacques et al. EMBO J. .

Abstract

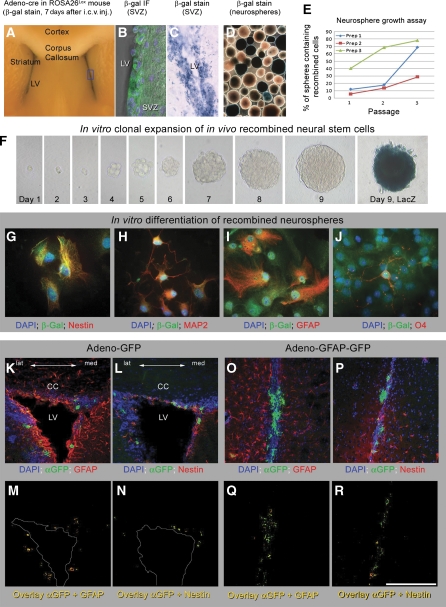
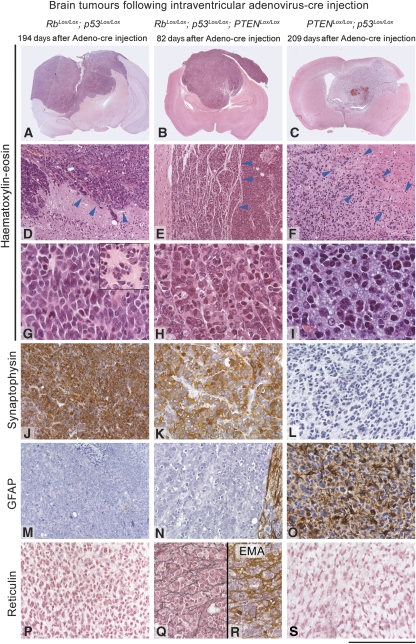
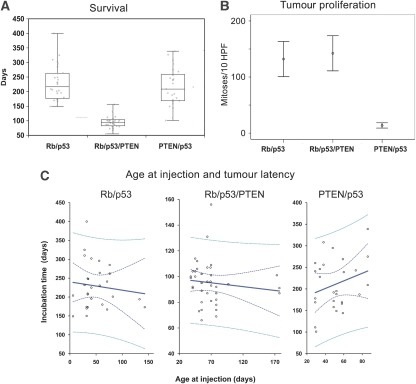
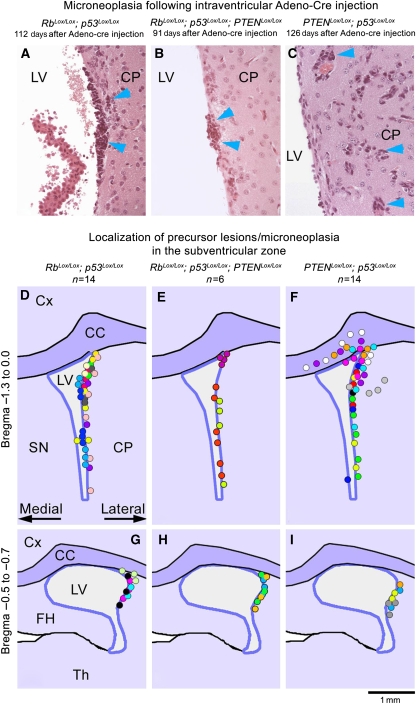
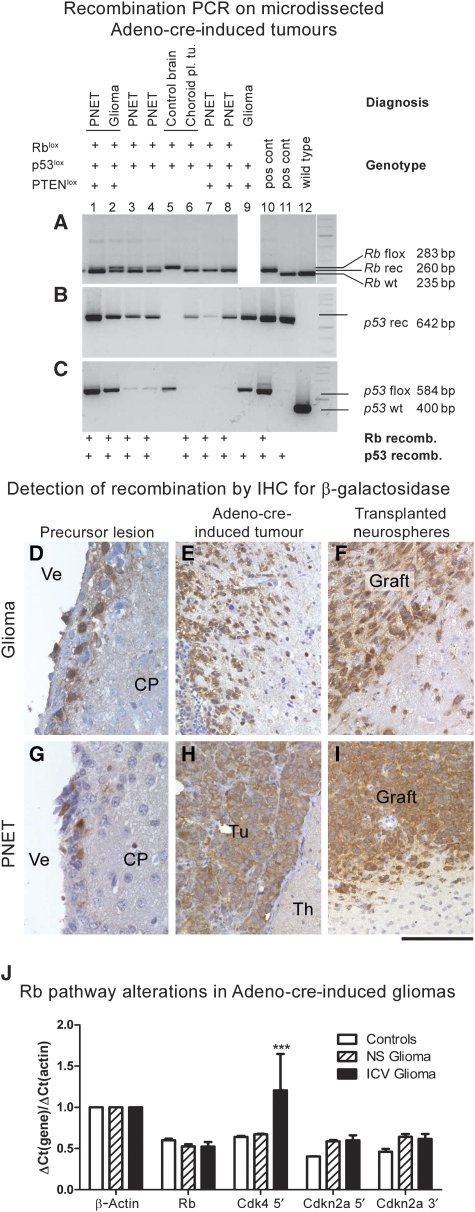
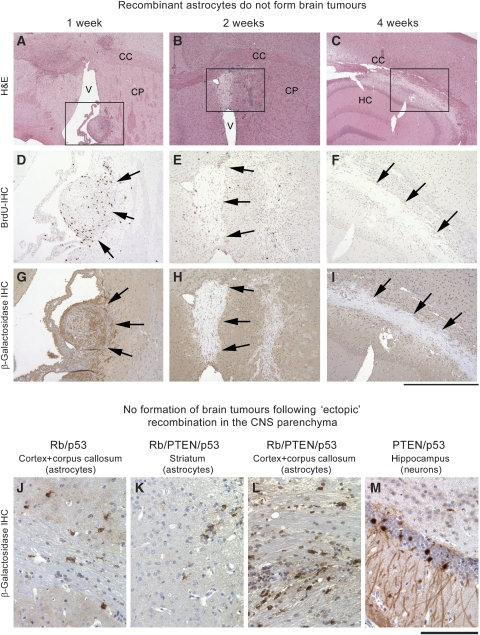
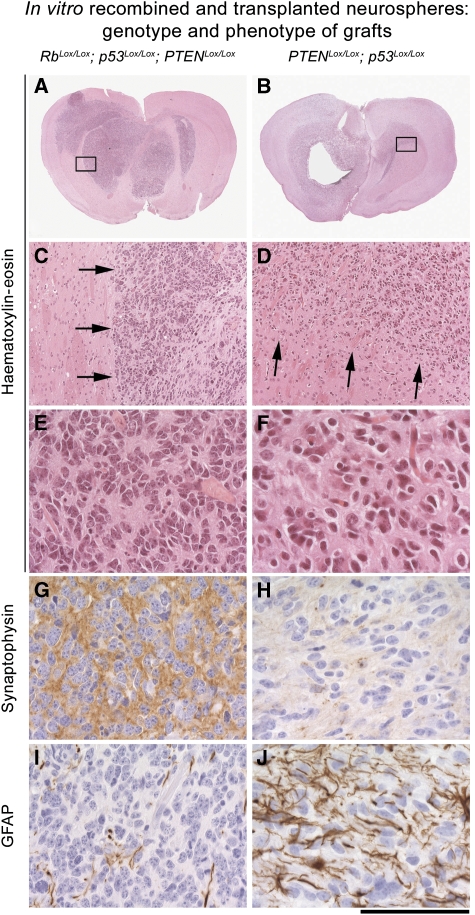
It has been suggested that intrinsic brain tumours originate from a neural stem/progenitor cell population in the subventricular zone of the post-natal brain. However, the influence of the initial genetic mutation on the phenotype as well as the contribution of mature astrocytes to the formation of brain tumours is still not understood. We deleted Rb/p53, Rb/p53/PTEN or PTEN/p53 in adult subventricular stem cells; in ectopically neurografted stem cells; in mature parenchymal astrocytes and in transplanted astrocytes. We found that only stem cells, but not astrocytes, gave rise to brain tumours, independent of their location. This suggests a cell autonomous mechanism that enables stem cells to generate brain tumours, whereas mature astrocytes do not form brain tumours in adults. Recombination of PTEN/p53 gave rise to gliomas whereas deletion of Rb/p53 or Rb/p53/PTEN generated primitive neuroectodermal tumours (PNET), indicating an important role of an initial Rb loss in driving the PNET phenotype. Our study underlines an important role of stem cells and the relevance of initial genetic mutations in the pathogenesis and phenotype of brain tumours.


Conflict of interest statement

The authors declare that they have no conflict of interest.

Figures

Figure 1
Figure 1
Intra-ventricular injections of adenovirus target a thin layer deep to the ependymal wall that includes the progenitor cells. (A) Coronal section through a ROSA26Lox mouse 7 days after intracerebro-ventricular injection with Adeno-cre. Recombined cells are restricted to a thin periventricular region. (B) Superimposed confocal and phase contrast image of the lateral wall of the lateral ventricle after immunostaining against β-gal, confirming that recombination is limited to a thin layer of cells beneath the ependyma. (C) LacZ histochemical stain on a vibratome section shows recombination in the SVZ. (D, E) Recombined neurospheres derived from ROSA26Lox mice following intraventricular injection with Adeno-cre (D); β-gal histochemistry on neurospheres. (E) Increasing proportion of positive cells during time in vitro. (F) In vivo-recombined, in vitro-expanded neural stem cells grow from single cells to neurospheres, demonstrating their ability to self-renew. Each image shows the same cell/sphere during self-renewal and growth, and on day 9 before (F9) and after LacZ staining (F, day 9, LacZ). (GJ) In vitro differentiation of in vivo recombined stem cells after clonal expansion from a single cell. Neurospheres were differentiated in vitro and double labelled for β-galactosidase (green) to detect cre-mediated recombination and a marker of differentiation (nestin, (G); MAP-2 (H); GFAP (I) and O4(J)), indicating their capability to differentiate into neuronal, glial and oligodendroglial lineages. (KN) Confocal images of coronal sections of the lateral ventricle of wild-type mice after injection by Adenovirus–GFP: (K, L) triple-labelled images; (M, N) co-localization of GFP and nestin (M) or GFAP (N). The same cell population is targeted with Adeno-GFAP-GFP (OR). Scale bar 200 μm (KR).
Figure 2
Figure 2
The phenotype of brain tumours is influenced by the initial genetic deletion: left column: tumours in Rb/p53 mice: (A, D, G, J, M, P); middle column: Rb/p53/PTEN tumour (B, E, H, K, N, Q, R); and right column: tumour derived from p53/PTEN mice (C, F, I, L, O, S). Panels AI are stained with haematoxylin and eosin. (D) Arrowheads point to the border between tumour and the adjacent non-neoplastic brain. (E) Arrowheads indicate thin septae of meningeal origin that separate tumour cells into trabeculae. (F) The area indicated by arrowheads is the ill-defined border between tumour (left) and brain (right; ‘infiltration zone'). (GI) High-power magnification shows the morphological differences between PNET (G, H) and glioma (I), with rosette formation (G, inset) in the PNETs. (JL) Synaptophysin immunohistochemistry shows strong positive labelling of all tumour cells in (J, K), and no expression in gliomas (L). (MO) GFAP immunohistochemical labelling with no expression in PNET (M, N). The small rim on the right in (N) is adjacent brain that shows strong reactive gliosis, and (O) shows GFAP expression in all glioma cells. (PS) The additional deletion of PTEN in a Rb/p53 background (Q, R) results in extensive desmoplastic reaction/meningeal infiltration: PTEN/Rb/p53 tumours show reticulin and epithelial membrane antigen (EMA)-positive structures separating nests of tumour cells (Q, R). No desmoplastic reaction in Rb/p53 PNET (P) or in PTEN/p53 gliomas (S). Scale bar: 5.2 mm (AC), 440 μm (DE), 110 μm (GI) and 220 μm (JS).
Figure 3
Figure 3
(A) The genotype determines the latency of tumour formation. Mean time (days to tumour presentation±95% confidence intervals). Rb/p53/PTEN has a significantly shortened latency. P<0.05 ANOVA, post-hoc Bonferroni, box plot with 95% of all samples. All tumour types were included. (B) The genotype determines the proliferation rate of the tumours: the graph shows mean mitotic counts per 10 high-power fields (× 40 objective)±95% confidence intervals, PTEN/p53 differs significantly from the other genotypes (P<0.05 ANOVA, post-hoc Bonferroni). All tumours examined were gliomas in PTEN/p53mice and PNET in two other genotypes. (C) The tumour latency is independent of the age at injection. The graph shows the relationship between age at injection and the tumour incubation time (development of neurological signs). Polynomial regression analysis was performed. None of the genotypes showed a significant correlation between age at injection and latency. Rb/p53: r=−0.22, P=0.55; Rb/p53/PTEN: r=−0.05, P=0.38; PTEN/p53: r=0.8, P=0.17. Solid blue line, linear fit; dotted blue line, 95% confidence interval; dotted green line, 95% prediction interval. A full-colour version of this figure is available at The EMBO Journal Online.
Figure 4
Figure 4
Small neoplastic lesions (‘microneoplasia') after intraventricular Adeno-cre injection precede brain tumours. Upper row (AC): Histological appearance of small neoplastic lesions located beneath the ependymal layer of the lateral wall of the ventricle. Occasionally, perivascular spread was seen in PTEN/p53 mice (C). (DI) Schematic representation of precursor lesions: cumulative maps showing the localization of small lesions. Each dot represents microneoplasia or a focal cluster of tumour cells (approximately 200 μm). Each colour represents an individual animal. The map summarizes lesions in 14 Rb/p53 mice, 6 Rb/p53/PTEN mice and 14 PTEN/p53 mice. The upper schematic panel (DF) summarizes lesions in the anterior ventricular region (Bregma −1.3 to 0.0) and the lower panel (GI) represents the posterior region (Bregma −0.5 to −0.7). The microneoplastic lesions are almost exclusively localized beneath the lateral wall of the ventricles and in the lateral corner of the ventricle, and may occasionally protrude to the opposite wall. Although Rb/p53 and Rb/p53/PTEN lesions tend to remain locally clustered, PTEN/p53 lesions often spread laterally and into the corpus callosum, in keeping with the more infiltrative nature of these tumours (F). One small lesion in an Rb/p53 animal (D, yellow dot) was observed extending to the medial side but may not have arisen there and one small lesion in a PTEN/p53 animal arose from the medial surface (F, blue dot), indicating a very strong preference for the lateral/dorsolateral walls, consistent with the presumed localization of SVZ stem cells. Cx, cortex; CC, corpus callosum; LV, lateral ventricle; SN, septal nuclei; FH, fimbria hippocampi and Th, thalamus.
Figure 5
Figure 5
Gene recombination in experimentally induced brain tumours: (AC) recombination PCR on microdissected tumours demonstrates recombination of floxed genes in brain tumours: Lanes 1 and 2: rare instance of two histologically distinct tumour phenotypes in the same brain (mouse genotype Rb/p53), both showing recombination of Rb (A) and p53 (B, C). Lanes 3, 4, 7 and 8 are further examples of recombination in PNETs, whereas lane 6 shows recombination in other tumour types and no recombination is seen in control tissue. Lane 8 shows glioma with recombination of p53. PTEN recombination was not tested in these tumours. (DI): Immunohistochemical detection of β-galactosidase in recombined cells of precursor lesions (D, G), Adeno-cre-induced primary brain tumours (E, H) and in tumours derived from grafted neurospheres that were recombined in vitro before implantation (F, I). As all mice carried the ROSA26lox gene, recombination results in β-galactosidase expression in recombined SVZ cells, microneoplasia and tumours but not in uninfected brain parenchyma. Ve, ventricle; CP, caudoputamen; Tu, tumour, Th, thalamus. Scale bar: 60 μm (D, G); 120 μm (E, F, H, I). (J) Expression analysis of the Rb pathway in primary tumours (solid bars) and grafts (shaded bars). RNA extracted from two normal forebrains served as controls (white bars). Gene transcripts: Rb, Cdk4, Cdkn2a 5′ (p16/Ink4a and p19/Arf), Cdkn2a 3′ (p19/Arf) and β-actin. The 5′ transcript of Cdk4 is significantly (P<0.001) upregulated in brain tumours, whereas there is a statistically non-significant upregulation of p16/Ink4a and p19/Arf transcripts.
Figure 6
Figure 6
Recombinant astrocytes do not form brain tumours. In vitro recombined astrocytes (PTEN/Rb/p53) were implanted into the striatum of recipient mice from identical genetic background. At 1 week after grafting (A, D, G) there are several nodules of spindle shaped cells in several locations, such as the ventricle, attached to the striatum (boxed area), immunostaining for BrdU shows frequent proliferating cells. (G) Recombined cells show expression of β-galactosidase (arrows) in the graft, but only background staining of the neuropil. After 2 weeks, the grafts have largely degenerated into gliotic scar tissue and show only infrequent proliferating residual cells (E, BrdU IHC). (H) β-galactosidase IHC shows absence of staining in these degenerate grafts, notably, this tissue gives less background stain than CNS tissue. At 4 weeks (C, F, I) only scar tissue remains and no more proliferating cells are seen (F), and β-galactosidase immunoreactivity is absent. Scale bar: 1.3 mm (AC), 550 μm (DI). (JM) Ectopic injection of Adeno-cre recombines grey and white matter astrocytes but does not cause their neoplastic transformation in vivo. Occasionally, hippocampal neurons were recombined, but no tumours formed.
Figure 7
Figure 7
In vitro-recombined neurospheres generate tumours with a phenotype that resembles those generated by in vivo recombination. Left column (A, C, E, G, I): tumours derived from injection of Rb/p53/PTEN neurospheres. Right column (B, D, F, H, J): tumours derived from injection of p53/PTEN neurospheres. Panels (AF) haematoxylin and eosin. Arrows in (C) and (D) show a well-demarcated (C) border in PNET or a diffuse infiltration into the CNS (D). Panels (G, H): synaptophysin is expressed in PNET (G) but not in gliomas (H). Panels (I, J) GFAP is not expressed in PNET (I) but clearly identifiable in neoplastic astrocytes in gliomas (J). Scale bar: 4 mm (A, B), 350 μm (C, D) and 90 μm (EJ).

References

    1. Akagi K, Sandig V, Vooijs M, Van der Valk M, Giovannini M, Strauss M, Berns A (1997) Cre-mediated somatic site-specific recombination in mice. Nucleic Acids Res 25: 1766–1773 - PMC - PubMed
    1. Alcantara Llaguno S, Chen J, Kwon CH, Jackson EL, Li Y, Burns DK, Alvarez-Buylla A, Parada LF (2009) Malignant astrocytomas originate from neural stem/progenitor cells in a somatic tumor suppressor mouse model. Cancer Cell 15: 45–56 - PMC - PubMed
    1. Alvarez-Buylla A, Kohwi M, Nguyen TM, Merkle FT (2008) The heterogeneity of adult neural stem cells and the emerging complexity of their niche. Cold Spring Harb Symp Quant Biol 73: 357–365 - PubMed
    1. Alvarez-Buylla A, Temple S (1998) Stem cells in the developing and adult nervous system. J Neurobiol 36: 105–110 - PubMed
    1. Bachoo RM, Maher EA, Ligon KL, Sharpless NE, Chan SS, You MJ, Tang Y, DeFrances J, Stover E, Weissleder R, Rowitch DH, Louis DN, DePinho RA (2002) Epidermal growth factor receptor and Ink4a/Arf: convergent mechanisms governing terminal differentiation and transformation along the neural stem cell to astrocyte axis. Cancer Cell 1: 269–277 - PubMed

Publication types

MeSH terms

Substances