. 2010 Jan 20;29(2):442-56.
doi: 10.1038/emboj.2009.336. Epub 2009 Nov 19.

NuRD mediates activating and repressive functions of GATA-1 and FOG-1 during blood development

Affiliations

NuRD mediates activating and repressive functions of GATA-1 and FOG-1 during blood development

Annarita Miccio et al. EMBO J. .

Abstract

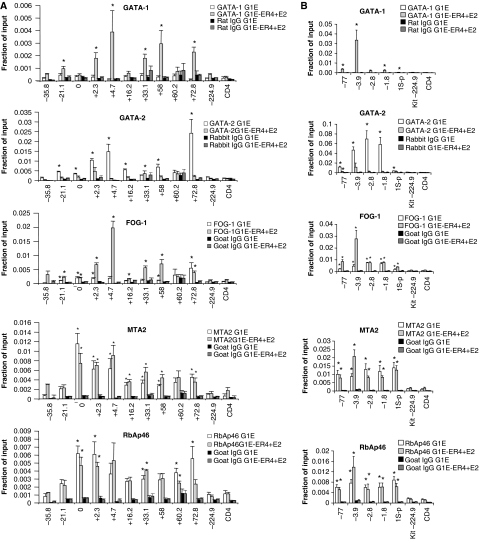
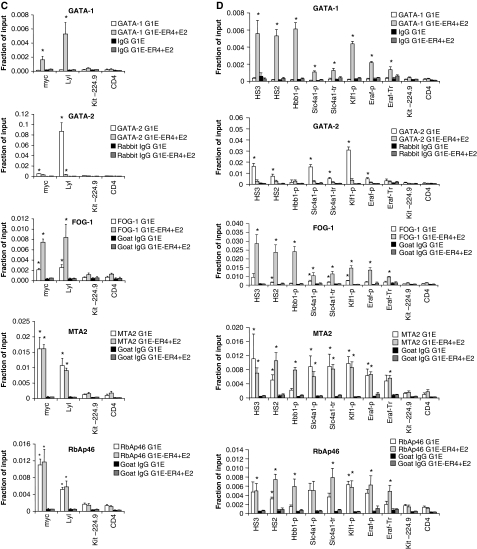
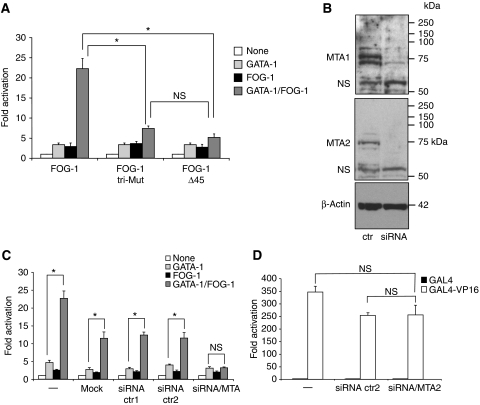
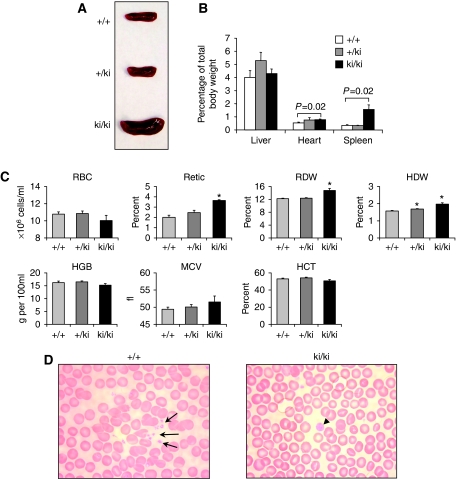
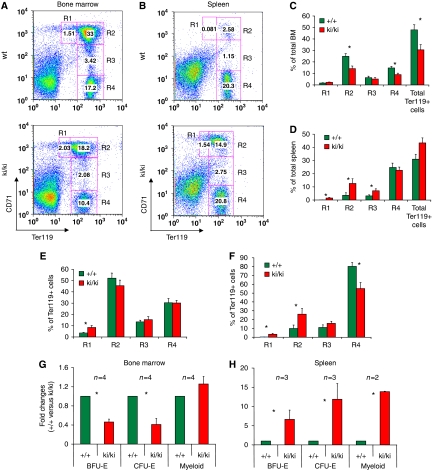
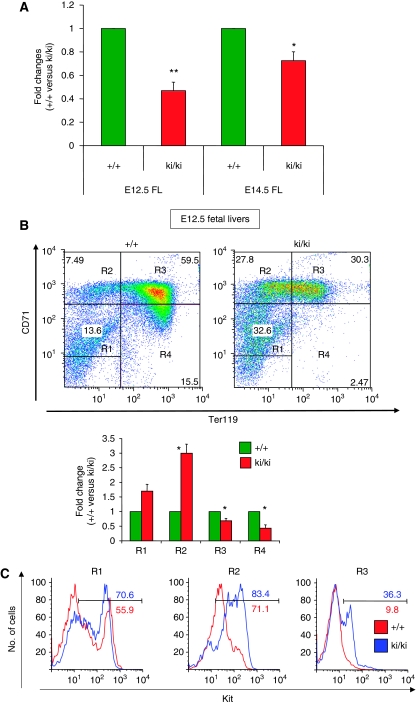
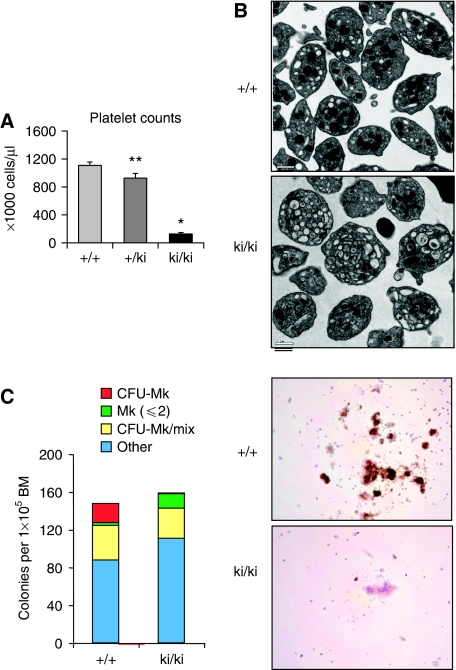
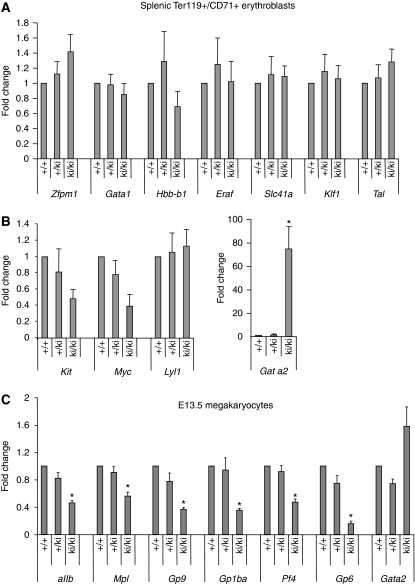
GATA transcription factors interact with FOG proteins to regulate tissue development by activating and repressing transcription. FOG-1 (ZFPM1), a co-factor for the haematopoietic factor GATA-1, binds to the NuRD co-repressor complex through a conserved N-terminal motif. Surprisingly, we detected NuRD components at both repressed and active GATA-1/FOG-1 target genes in vivo. In addition, while NuRD is required for transcriptional repression in certain contexts, we show a direct requirement of NuRD also for FOG-1-dependent transcriptional activation. Mice in which the FOG-1/NuRD interaction is disrupted display defects similar to germline mutations in the Gata1 and Fog1 genes, including anaemia and macrothrombocytopaenia. Gene expression analysis in primary mutant erythroid cells and megakaryocytes (MKs) revealed an essential function for NuRD during both the repression and activation of select GATA-1/FOG-1 target genes. These results show that NuRD is a critical co-factor for FOG-1 and underscore the versatile use of NuRD by lineage-specific transcription factors to activate and repress gene transcription in the appropriate cellular and genetic context.


Conflict of interest statement

The authors declare that they have no conflict of interest.

Figures

Figure 1A-B
Figure 1A-B
FOG-1 and NuRD proteins occupy active and repressed GATA-1 target genes. ChIP at the repressed GATA-1 target genes Kit (A), Gata2 (B), Myc and Lyl1
Figure 1C-D
Figure 1C-D
(C) using antibodies anti-GATA-1, GATA-2, FOG-1, MTA2, RbAp46 and the corresponding control IgG, in G1E and G1E-ER4 cells after treatment with oestradiol for 24 h. (D) FOG-1 and NuRD ChIP at sites in which GATA-1 functions as an activator. HS2, DNase hypersensitive sites 2. The regions at 224.9 kb upstream of the Kit promoter and in the first intron of CD4 serve as negative control. The results are averages of 4–10 independent experiments. Error bars represent s.e.m. Statistical significance was determined by comparing the occupancy at each site and negative control regions; *P<0.05.
Figure 2
Figure 2
NuRD binding is required for transcriptional activation by FOG-1. Transient transfection of 3T3 cells with constructs expressing GATA-1, FOG-1 and a luciferase reporter gene driven by the αIIb promoter. FOG-1 mutants bearing triple point mutations (tri-mut) or a deletion of the NuRD-binding domain (Δ45) fail to substantially activate GATA-1-dependent transcription (A). Bars denote averages of five independent experiments. Error bars represent s.e.m. *P<0.05; NS: not significant. (B) Western blots of cells co-transfected with siRNAs against MTA-1 and MTA-2. NS, non-specific bands. (C) Transient transfections as in (A), but 24 h before transfection with GATA-1, FOG-1 and the reporter gene, cells were additionally transfected with MTA-1, MTA-2 and MTA-3 siRNAs, no siRNAs (mock), or two different control siRNAs (ctr1 and ctr2). Note that the exposure to an additional round of transfection leads to non-specific reduction in GATA-1/FOG-1 activity. The results are averages of 3–12 independent experiments. Error bars represent s.e.m. *P<0.05; NS: not significant. (D) 3T3 cells were treated with control siRNA (siRNA ctr2) or siRNA against MTA-1 and MTA-2 (siRNA/MTA) as in (C); 24 h later, GAL4–VP16 or GAL4 alone were co-transfected with a reporter gene driven by the thymidine kinase promoter and containing 5 GAL4-binding sites; n=3 (error bars denote s.e.m.; NS: not significant).
Figure 3
Figure 3
(A) Spleens from 6-week-old mice with indicated genotype. (B) Organ weights plotted as per cent of total body weight (n=4). (C) Red blood cell indices of wild-type (+/+, n=15), heterozygous (+/ki, n=11) and homozygous mutant (ki/ki, n=10) animals. Error bars represent s.e.m. P-values were determined by two-tailed t-tests. *P<0.001. (D) Giemsa—Wright-stained peripheral blood smears from +/+ and ki/ki mice. Note scarcity of normal sized platelets and the presence of enlarged platelets.
Figure 4
Figure 4
Erythroid defects in ki/ki erythroid cells from bone marrows (A, C, E, G) and spleens (B, D, F, H). (A, B) Representative flow cytometric analysis using CD71 and Ter119 antibodies. R1, R2, R3 and R4 represent proerythroblasts, basophilic, polychromatic and othrochromatic erythroblasts, respectively (Socolovsky et al, 2001) and were plotted as per cent of total (C, D) or per cent of Ter119+ cells (E, F). Error bars represent s.e.m. n=7 (C, D) n=9 (D, F). *P<0.05. (G, H) Colony assays measuring BFU-E and CFU-E from bone marrows and spleens. The results were plotted as fold changed comparing +/+ with ki/ki-derived samples. N-values are indicated for each graph. *P<0.05.
Figure 5
Figure 5
Hypocellularity (A) and erythroid maturation defects in ki/ki erythroid cells from E12.5 foetal livers as revealed by flow cytometric analysis using CD71 and Ter119 antibodies (B). R1, R2, R3 and R4 represent immature erythroblasts, proerythroblasts, basophilic and polychromatic/orthrochromatic erythroblasts, respectively (Zhang et al, 2003) and were plotted as per cent of total cells. (C) R1, R2 and R3, populations from (B), were analysed by flow cytometry for surface expression of Kit. Note residual expression of kit in R2 to R4 populations, which might reflect a delay in kit silencing. Error bars represent s.e.m. n=4 E12.5 litters and n=3 E14.5 litters. *P<0.05. **P<0.005.
Figure 6
Figure 6
(A) Platelet counts of wild-type (+/+, n=15), heterozygous (+/ki, n=11) and homozygous mutant (ki/ki, n=10) animals. Error bars represent s.e.m. *P<0.001; **P<0.05. (B) Electron micrographs of +/+ and ki/ki platelets. (C) Reduced MK potential in ki/ki mice as revealed by colony assays from bone marrows. ki/ki bone marrows produced markedly fewer CFU-Mk colonies in but increased numbers of single MKs. Right panel: acetyl-cholinesterase (AChE) stain of representative colonies.
Figure 7
Figure 7
Expression of GATA-1-activated (A) and repressed genes (B) in stage-matched (R3) +/+, +/ki and ki/ki erythroid cells as determined by real-time RT–PCR, normalized to GAPDH and plotted as fold change from +/+ samples. (C) mRNA levels of indicated genes in MKs cultured under serum-free conditions from E13.5 MKs determined by qRT–PCR. The results are averages of seven independent experiments. Error bars represent s.e.m. *P<0.05.

References

    1. Bowen NJ, Fujita N, Kajita M, Wade PA (2004) Mi-2/NuRD: multiple complexes for many purposes. Biochim Biophys Acta 1677: 52–57 - PubMed
    1. Cantor AB, Iwasaki H, Arinobu Y, Moran TB, Shigematsu H, Sullivan MR, Akashi K, Orkin SH (2008) Antagonism of FOG-1 and GATA factors in fate choice for the mast cell lineage. J Exp Med 205: 611–624 - PMC - PubMed
    1. Cantor AB, Katz SG, Orkin SH (2002) Distinct domains of the GATA-1 cofactor FOG-1 differentially influence erythroid versus megakaryocytic maturation. Mol Cell Biol 22: 4268–4279 - PMC - PubMed
    1. Chang AN, Cantor AB, Fujiwara Y, Lodish MB, Droho S, Crispino JD, Orkin SH (2002) GATA-factor dependence of the multitype zinc-finger protein FOG-1 for its essential role in megakaryopoiesis. Proc Natl Acad Sci USA 99: 9237–9242 - PMC - PubMed
    1. Chen CJ, Deng Z, Kim AY, Blobel GA, Lieberman PM (2001) Stimulation of CREB binding protein nucleosomal histone acetyltransferase activity by a class of transcriptional activators. Mol Cell Biol 21: 476–487 - PMC - PubMed

Publication types

MeSH terms

Substances