. 2009 Sep;13(9B):4061-76.
doi: 10.1111/j.1582-4934.2009.00975.x. Epub 2009 Nov 19.

Altered distribution of tight junction proteins after intestinal ischaemia/reperfusion injury in rats

Affiliations

Altered distribution of tight junction proteins after intestinal ischaemia/reperfusion injury in rats

Qiurong Li et al. J Cell Mol Med. 2009 Sep.

Abstract

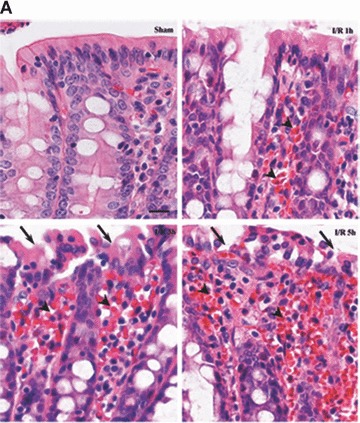
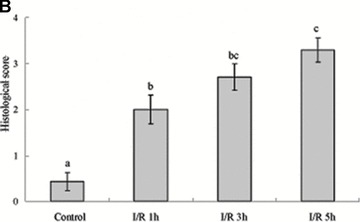
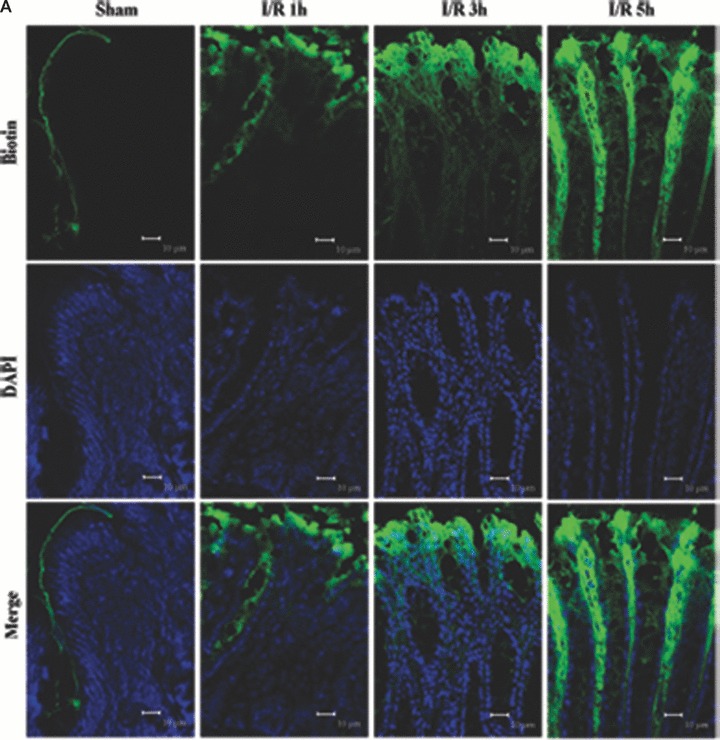
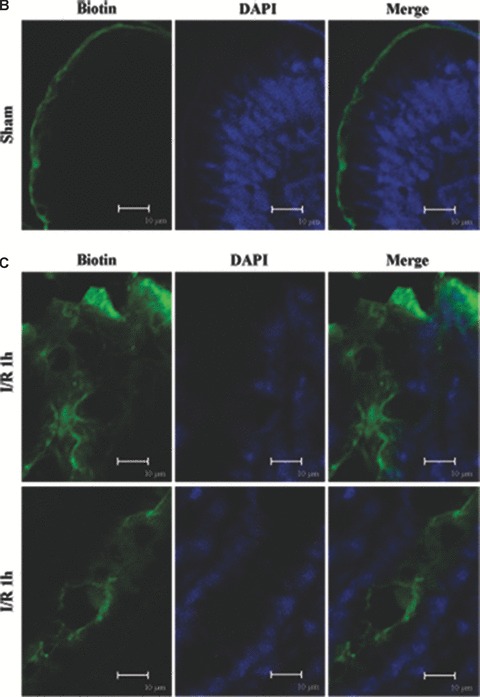
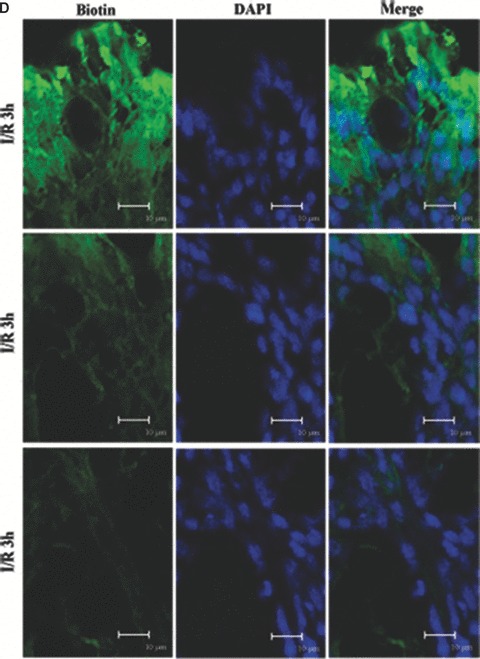
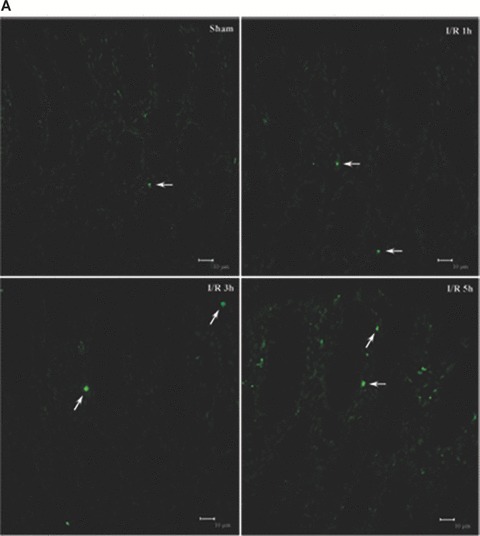
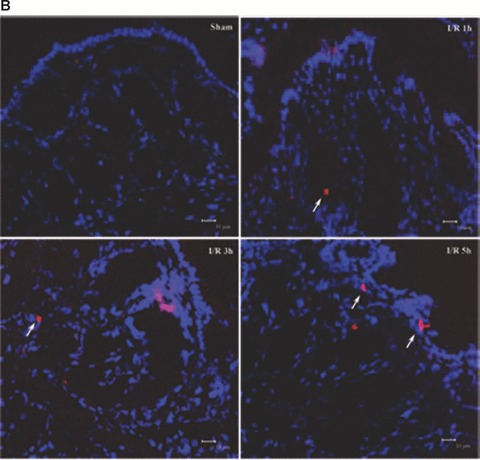
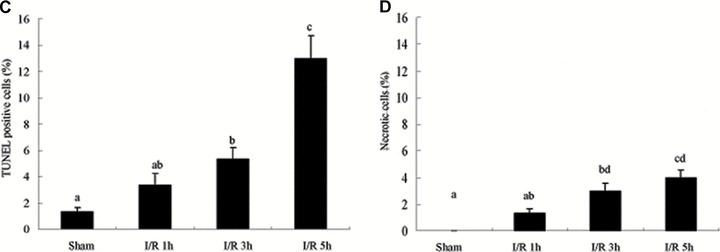
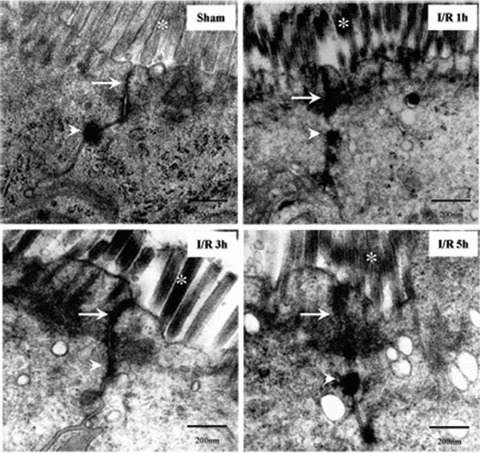
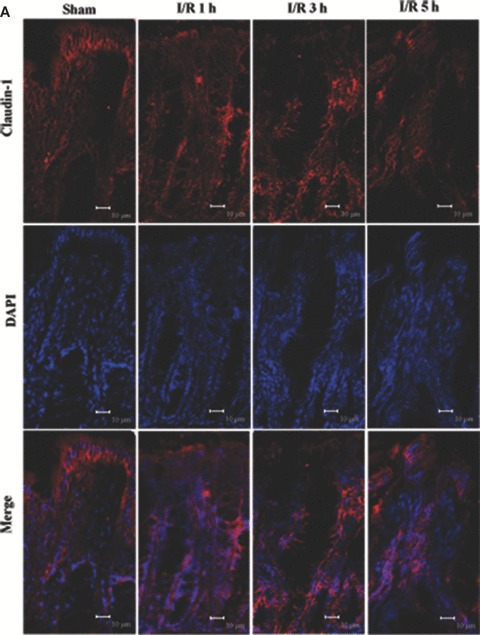
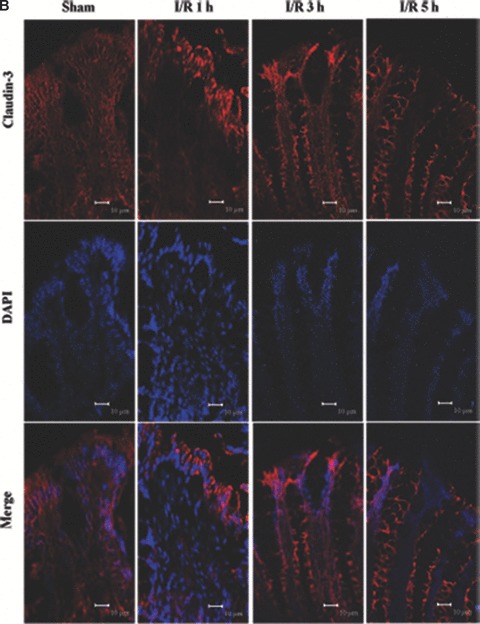
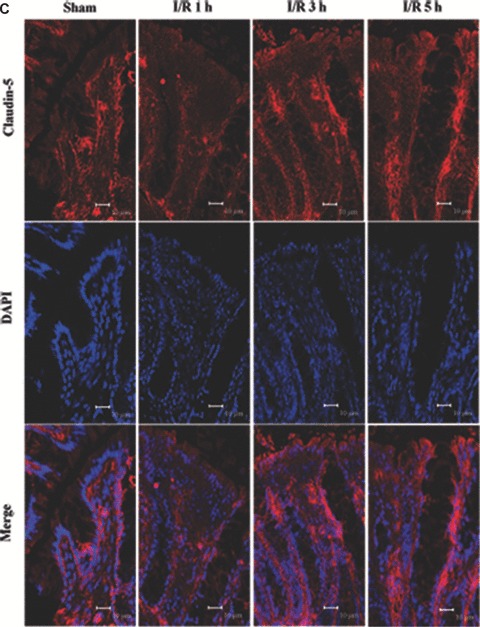
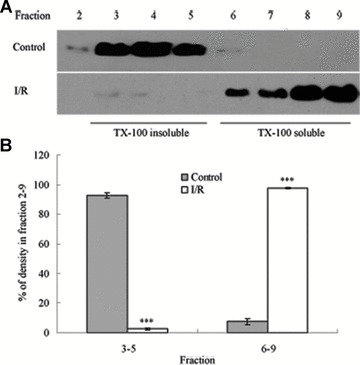
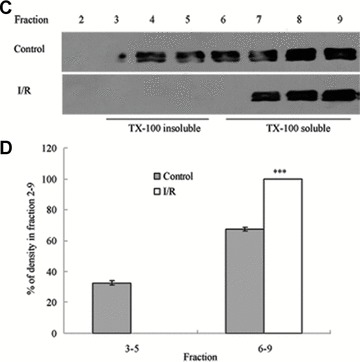
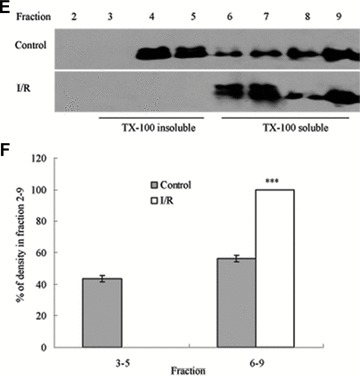
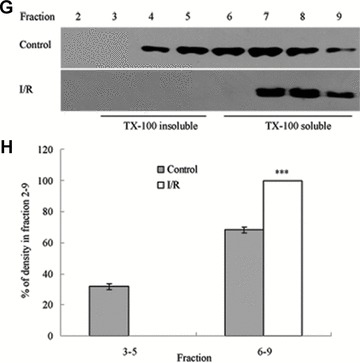
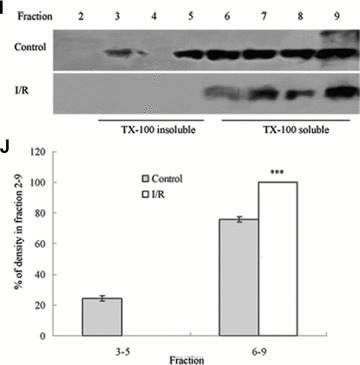
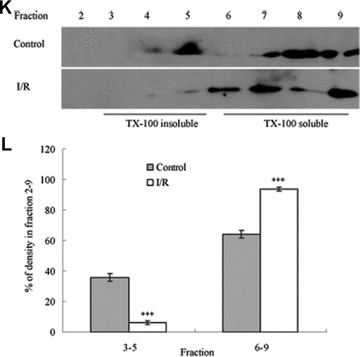
Tight junction (TJ) disruptions have been demonstrated both in vitro and more recently in vivo in infection. However, the molecular basis for changes of TJ during ischaemia-reperfusion (I/R) injury is poorly understood. In the present study, intestinal damage was induced by I/R in an animal model. As assessed by TUNEL and propidium iodide uptake, we showed that I/R injury induced apoptosis as well as necrosis in rat colon, and the frequency of apoptotic and necrotic cells reached the maximum at 5 hrs of reperfusion. Immunofluorescence microscopy revealed that claudins 1, 3 and 5 are strongly expressed in the surface epithelial cells of the colon; however, labelling of all three proteins was present diffusely within cells and no longer focused at the lateral cell boundaries after I/R. Using Western blot analysis, we found that distribution of TJ proteins in membrane microdomains of TJ was markedly affected in I/R injury rats. Occludin, ZO-1, claudin-1 and claudin-3 were completely displaced from TX-100 insoluble fractions to TX-100 soluble fractions, and claudin-5 was partly displaced. The distribution of lipid raft marker protein caveolin-1 was also changed after I/R. I/R injury results in the disruption of TJs, which characterized by relocalization of the claudins 1, 3 and 5 and an increase in intestinal permeability using molecular tracer measurement. I/R injury altered distribution of TJ proteins in vivo that was associated with functional TJ deficiencies.


Figures

Figure 1
Figure 1
Histopathological findings of haematoxylin & eosin-stained sections of the rat colon (A) (×400). Control group showing normal histopathology. I/R group animals at 1, 3 and 5 hrs after reperfusion demonstrating denuded villi and architectural disintegration. Seven rats were involved in each group. Arrows, denuded villi; arrow heads, haemorrhage. Bar = 5 μm. Histopathological scoring of colon tissue sections (B). The mucosal injury of the HE-stained colon tissues were evaluated by a pathologist. Note that there is a significant increase in the injury score after I/R. Data were mean ± S.E.M., and seven rats were involved in each group. Different letters indicate significant difference by Turkey’s multiple comparison test at 0.05 leve1.
Figure 1
Figure 1
Histopathological findings of haematoxylin & eosin-stained sections of the rat colon (A) (×400). Control group showing normal histopathology. I/R group animals at 1, 3 and 5 hrs after reperfusion demonstrating denuded villi and architectural disintegration. Seven rats were involved in each group. Arrows, denuded villi; arrow heads, haemorrhage. Bar = 5 μm. Histopathological scoring of colon tissue sections (B). The mucosal injury of the HE-stained colon tissues were evaluated by a pathologist. Note that there is a significant increase in the injury score after I/R. Data were mean ± S.E.M., and seven rats were involved in each group. Different letters indicate significant difference by Turkey’s multiple comparison test at 0.05 leve1.
Figure 2
Figure 2
Barrier permeability micrographs of I/R injury. (A) Low magnification confocal projections of a biotin tracer to assess barrier permeability using control and I/R rat tissue. (B–E) Higher magnification of biotin- and DAPI-treated colon tissue of control and I/R rat. Biotin is held to the luminal border in control tissue (A, B). Biotin staining was deep to the epithelial surface at 1 hr of reperfusion (A, C). The fluorescent labelling was observed within and between many colonic epithelial cells after 3 hrs (A, D). Biotin signal extended into the lamina propria and resulted in staining throughout the tissue following 5 hrs I/R injury (A, E) reperfusion. Biotion was seen in green colour and nuclei were stained with DAPI (blue). The merging image of green biotin and blue nuclei was also presented. Images shown are representative of three experiments. Bars = 10 μm.
Figure 2
Figure 2
Barrier permeability micrographs of I/R injury. (A) Low magnification confocal projections of a biotin tracer to assess barrier permeability using control and I/R rat tissue. (B–E) Higher magnification of biotin- and DAPI-treated colon tissue of control and I/R rat. Biotin is held to the luminal border in control tissue (A, B). Biotin staining was deep to the epithelial surface at 1 hr of reperfusion (A, C). The fluorescent labelling was observed within and between many colonic epithelial cells after 3 hrs (A, D). Biotin signal extended into the lamina propria and resulted in staining throughout the tissue following 5 hrs I/R injury (A, E) reperfusion. Biotion was seen in green colour and nuclei were stained with DAPI (blue). The merging image of green biotin and blue nuclei was also presented. Images shown are representative of three experiments. Bars = 10 μm.
Figure 3
Figure 3
Analysis of apoptosis and necrosis in colons of I/R injury rats. (A) Representative TUNEL stains in colon tissues obtained from sham-operated and I/R rats. Apoptotic cells were shown as bright green fluorescence staining. (B) Detection of necrosis with PI staining. The DAPI (blue) and PI (red) fluorescence were shown. Quantitative analysis of TUNEL+ cells (C) and necrotic cells (D) in the colon at various time-points of reperfusion after 1 hrs ischaemia. White arrows depict TUNEL+ cells (A) and necrotic cells (B). Bars = 10 μm.
Figure 3
Figure 3
Analysis of apoptosis and necrosis in colons of I/R injury rats. (A) Representative TUNEL stains in colon tissues obtained from sham-operated and I/R rats. Apoptotic cells were shown as bright green fluorescence staining. (B) Detection of necrosis with PI staining. The DAPI (blue) and PI (red) fluorescence were shown. Quantitative analysis of TUNEL+ cells (C) and necrotic cells (D) in the colon at various time-points of reperfusion after 1 hrs ischaemia. White arrows depict TUNEL+ cells (A) and necrotic cells (B). Bars = 10 μm.
Figure 4
Figure 4
Transmission electron micrograph of mucosa subjected to I/R injury. In control, TJ and desmosome are intact. While, alteration of TJ ultrastructure was observed in I/R group animals at 1, 3 and 5 hrs after reperfusion. Less electron-dense materials were present between the adjoining cells near the brush border, which indicated the disruption of normal TJ morphology. And the amounts of microvillus decreased and the arrangement were irregular. Arrows, TJ; Arrow heads, desmosome; Asterisks, microvilli. Bars = 200 nm.
Figure 5
Figure 5
Altered localization of claudin-1, 3 and 5 following I/R injury. The respective claudins (red) and nuclei (blue) images were obtained by immunofluorescence analysis of tissue sections of control rat colon and I/R injury (n= 7). In controls, claudin-1, 3 and 5 exhibited the characteristic lateral membrane staining in the surface epithelial cells. At 1, 3 and 5 hrs after reperfusion, labelling of all three proteins was present diffusely within cells rather than along the lateral cell boundaries. (A) Claudin-1 distribution; (B) claudin-3 distribution; (C) claudin-5 distribution. Bars = 10 μm.
Figure 5
Figure 5
Altered localization of claudin-1, 3 and 5 following I/R injury. The respective claudins (red) and nuclei (blue) images were obtained by immunofluorescence analysis of tissue sections of control rat colon and I/R injury (n= 7). In controls, claudin-1, 3 and 5 exhibited the characteristic lateral membrane staining in the surface epithelial cells. At 1, 3 and 5 hrs after reperfusion, labelling of all three proteins was present diffusely within cells rather than along the lateral cell boundaries. (A) Claudin-1 distribution; (B) claudin-3 distribution; (C) claudin-5 distribution. Bars = 10 μm.
Figure 6
Figure 6
Western blotting analysis of the lipid raft marker protein caveolin-1 and TJ protein Occludin, ZO-1 and claudins 1, 3 and 5. Tissues were homogenized and subjected to discontinuous sucrose density gradient ultracentrifugation. The resulted fractions were analysed by immunoblotting. Blots were probed with antibodies and analysed quantitatively by densitometry with Quantity One 1-D analysis software. The proteins examined were found to translocate from TX-100 insoluble fractions to TX-100 soluble fractions. The blots shown are representative of three experiments. (A, B) Caveolin-1; (C, D) Occludin; (E, F) ZO-1; (G, H) claudin-1; (I, J) claudin-3; (K, L) claudin-5. Data presented were mean ± S.E.M. (***P < 0.001).
Figure 6
Figure 6
Western blotting analysis of the lipid raft marker protein caveolin-1 and TJ protein Occludin, ZO-1 and claudins 1, 3 and 5. Tissues were homogenized and subjected to discontinuous sucrose density gradient ultracentrifugation. The resulted fractions were analysed by immunoblotting. Blots were probed with antibodies and analysed quantitatively by densitometry with Quantity One 1-D analysis software. The proteins examined were found to translocate from TX-100 insoluble fractions to TX-100 soluble fractions. The blots shown are representative of three experiments. (A, B) Caveolin-1; (C, D) Occludin; (E, F) ZO-1; (G, H) claudin-1; (I, J) claudin-3; (K, L) claudin-5. Data presented were mean ± S.E.M. (***P < 0.001).

References

    1. Schneeberger EE, Lynch RD. The tight junction: a multifunctional complex. Am J Physiol Cell Physiol. 2004;286:C1213–28. - PubMed
    1. Hawker PC, McKay JS, Turnberg LA. Electrolyte transport across colonic mucosa from patients with inflammatory bowel disease. Gastroenterology. 1980;79:508–11. - PubMed
    1. Sandle GI, Higgs N, Crowe P. Cellular basis for defective electrolyte transport in inflamed human colon. Gastroenterology. 1990;99:97–105. - PubMed
    1. Gassler N, Rohr C, Schneider A, et al. Inflammatory bowel disease is associated with changes of enterocytic junctions. Am J Physiol Gastrointest Liver Physiol. 2001;281:G216–28. - PubMed
    1. Guttman JA, Fereshte N, Samji FN, et al. Evidence that tight junctions are disrupted due to intimate bacterial contact and not inflammation during attaching and effacing pathogen infection in vivo. Infect Immun. 2006;74:6075–84. - PMC - PubMed

Publication types