

Effects of the El Niño-southern oscillation on dengue epidemics in Thailand, 1996-2005
- PMID: 19930557
- PMCID: PMC2785791
- DOI: 10.1186/1471-2458-9-422
Effects of the El Niño-southern oscillation on dengue epidemics in Thailand, 1996-2005
Abstract
Background: Despite intensive vector control efforts, dengue epidemics continue to occur throughout Southeast Asia in multi-annual cycles. Weather is considered an important factor in these cycles, but the extent to which the El Niño-Southern Oscillation (ENSO) is a driving force behind dengue epidemics remains unclear.
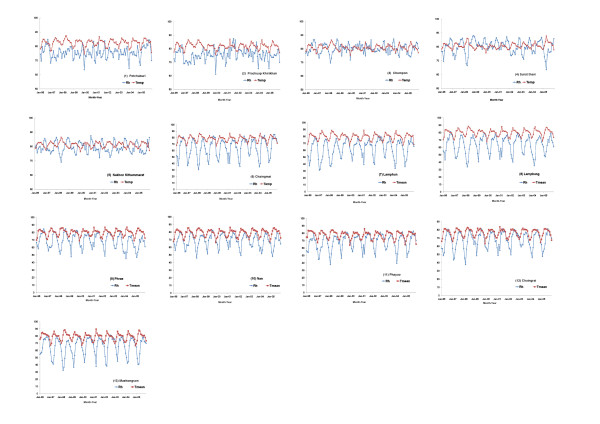
Methods: We examined the temporal relationship between El Niño and the occurrence of dengue epidemics, and constructed Poisson autoregressive models for incidences of dengue cases. Global ENSO records, dengue surveillance data, and local meteorological data in two geographically diverse regions in Thailand (the tropical southern coastal region and the northern inland mountainous region) were analyzed.
Results: The strength of El Niño was consistently a predictor for the occurrence of dengue epidemics throughout time lags from 1 to 11 months in the two selected regions of Thailand. Up to 22% (in 8 northern inland mountainous provinces) and 15% (in 5 southern tropical coastal provinces) of the variation in the monthly incidence of dengue cases were attributable to global ENSO cycles. Province-level predictive models were fitted using 1996-2004 data and validated with out-of-fit data from 2005. The multivariate ENSO index was an independent predictor in 10 of the 13 studied provinces.
Conclusion: El Niño is one of the important driving forces for dengue epidemics across the geographically diverse regions of Thailand; however, spatial heterogeneity in the effect exists. The effects of El Niño should be taken into account in future epidemic forecasting for public health preparedness.
Figures


References
-
- World Health Organization. Dengue and dengue haemorrhagic fever. Factsheet. 2008. http://www.who.int/mediacentre/factsheets/fs117/en
-
- World Health Organization Region Office for Southeast Asia. Reported cases of DF/DHF in selected countries in SEA region (1985-2005) 2007. http://www.searo.who.int/EN/Section10/Section332_1101.htm accessed Oct 1, 2008.
-
- Gubler D. The emergence of epidemic dengue fever and dengue hemorrhagic fever in the Americas: a case of failed public health policy. Rev Panam Salud Publica/Pan Am J Public Health. 2005;17:221–224. - PubMed
-
- Timmermann A, Oberhuber J, Bacher A, Esch M, Latif M, Roeckner E. Increased El Niño frequency in a climate model forced by future greenhouse warming. Nature. 1999;398:694–697. doi: 10.1038/19505. - DOI
Publication types
MeSH terms
LinkOut - more resources
Full Text Sources
Medical
