. 2009 Nov 21:10:550.
doi: 10.1186/1471-2164-10-550.

A whole genome Bayesian scan for adaptive genetic divergence in West African cattle

Affiliations

A whole genome Bayesian scan for adaptive genetic divergence in West African cattle

Mathieu Gautier et al. BMC Genomics. .

Abstract

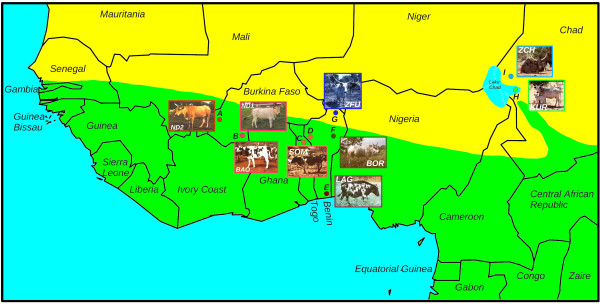
Background: The recent settlement of cattle in West Africa after several waves of migration from remote centres of domestication has imposed dramatic changes in their environmental conditions, in particular through exposure to new pathogens. West African cattle populations thus represent an appealing model to unravel the genome response to adaptation to tropical conditions. The purpose of this study was to identify footprints of adaptive selection at the whole genome level in a newly collected data set comprising 36,320 SNPs genotyped in 9 West African cattle populations.

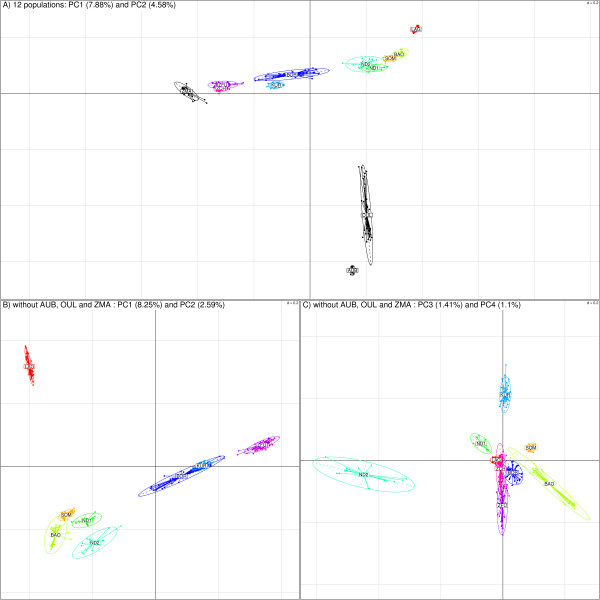
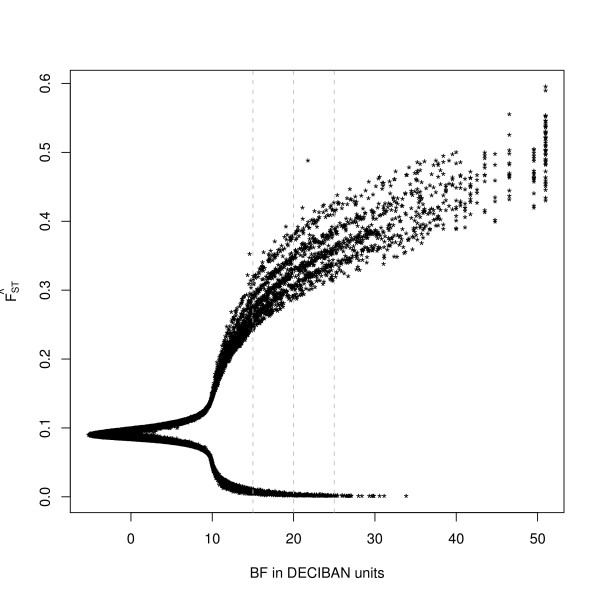
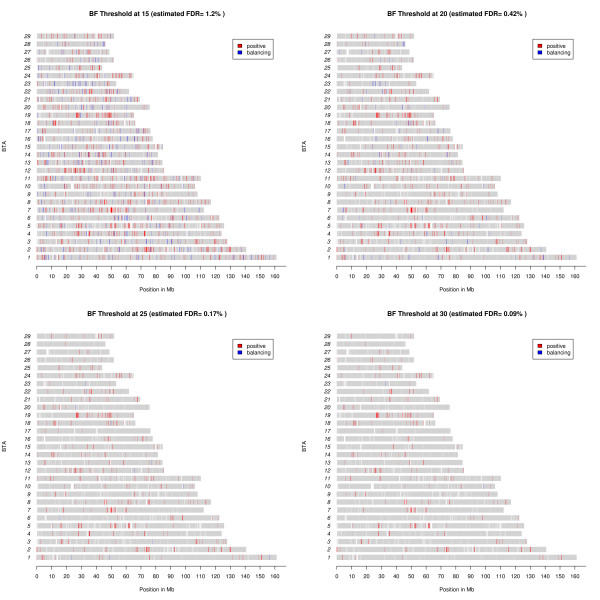
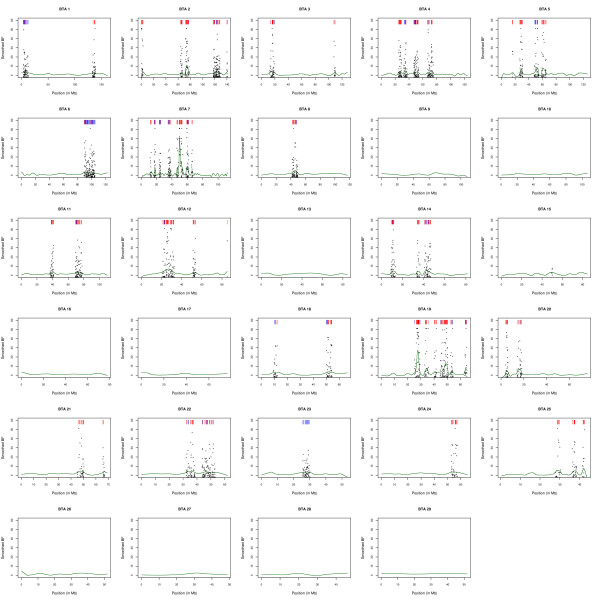
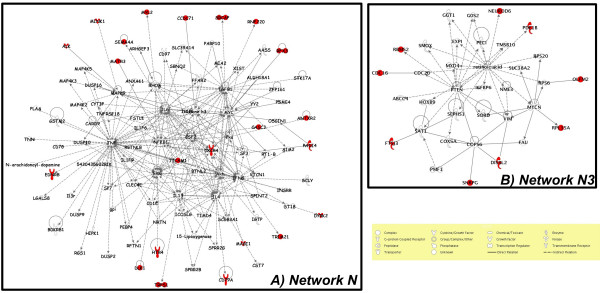
Results: After a detailed analysis of population structure, we performed a scan for SNP differentiation via a previously proposed Bayesian procedure including extensions to improve the detection of loci under selection. Based on these results we identified 53 genomic regions and 42 strong candidate genes. Their physiological functions were mainly related to immune response (MHC region which was found under strong balancing selection, CD79A, CXCR4, DLK1, RFX3, SEMA4A, TICAM1 and TRIM21), nervous system (NEUROD6, OLFM2, MAGI1, SEMA4A and HTR4) and skin and hair properties (EDNRB, TRSP1 and KRTAP8-1).

Conclusion: The main possible underlying selective pressures may be related to climatic conditions but also to the host response to pathogens such as Trypanosoma(sp). Overall, these results might open the way towards the identification of important variants involved in adaptation to tropical conditions and in particular to resistance to tropical infectious diseases.


Figures

Figure 1
Figure 1
Origin of the West African population samples. A) N'Dama ND2 samples (n = 17) originated from the Samandeni ranch in Burkina Faso [64]; B) Baoulé (BAO) samples (n = 29) and N'Dama ND1 (n = 14) originated from the Gaoua Ranch in Burkina-Faso [64]; C) and D) Somba (SOM) samples (n = 44) originated from Boukombe (Benin) and Nadoba (Togo) regions [65]; E) Lagune (LAG) samples (n = 44) originated from the Porto Novo region in Benin [65]; F) Borgou (BOR) samples (n = 45) originated from the Parakou district in Benin [65]; G) Sudanese Fulani (ZFU) samples (n = 43) originated from the Malanville region in Benin [65]; H) Kuri (KUR) samples (n = 47) were collected in Lake Chad islands [64] and I) Choah zebu (ZCH) samples originated from the Bol district in Chad [64]. The tsetse infested region is colored in green on the map.
Figure 2
Figure 2
PCA results. Plots of the individuals according to their coordinates on the first two principal components on the eigenanalysis with (A) and without (B) the three outgroup populations (AUB, OUL and ZMA). Plots on the third and fourth components for this latter analysis are shown on Figure 2C. Ellipses characterize the dispersion of each breed around its center of gravity (assuming the cloud is a random sample distributed according to a bivariate gaussian distribution, the probability for an individual to be within the ellipse is 0.9).
Figure 3
Figure 3
Plot of the estimate of the locus FST against Bayes Factor. The three dashed lines represent the 15, 20 and 25 BF threshold.
Figure 4
Figure 4
Genome position of the locus declared under selection. For each BF thresholds, the color indicates whether the SNP is neutral (grey), under positive selection (red) or balancing selection (blue). The type of selection (balancing or positive) is deduced from the SNP FST value (< 0.1 or > 0.1).
Figure 5
Figure 5
Whole genome map of regions under selection at the 5% local FDR (q-value) threshold. For each of the 29 bovine autosomes, the smoothed BF is plotted against the chromosomal position (green line). For significant positions, non smoothed SNP BF are indicated by a black star. At the corresponding positions, a red (blue) bar is represented on the top of each graph if the SNP was under positive (balancing) selection i.e. displayed a (non smoothed) BF > 15 and a FST > 0.1 (FST < 0.1).
Figure 6
Figure 6
Representation of the N (A) and N3 (B) gene networks. Symbols corresponding to candidate genes are colored in red.

References

    1. Hanotte O, Bradley DG, Ochieng JW, Verjee Y, Hill EW, Rege JE. African pastoralism: genetic imprints of origins and migrations. Science. 2002;296(5566):336–339. doi: 10.1126/science.1069878. - DOI - PubMed
    1. Epstein H. The Origins of the Domestic Animals of Africa. Vol. 1. London: Africana Publishing Corporation; 1971.
    1. Payne WJA, Hodges J. Tropical Cattle, Origins, Breeds and Breeding Policies. Oxford: Blackwell Science Ltd; 1997.
    1. Freeman AR, Meghen CM, Machugh DE, Loftus RT, Achukwi MD, Bado A, Sauveroche B, Bradley DG. Admixture and diversity in West African cattle populations. Mol Ecol. 2004;13(11):3477–3487. doi: 10.1111/j.1365-294X.2004.02311.x. - DOI - PubMed
    1. Williamson G, Payne WJA. An introduction to Animal Husbandry in the Tropics. English Language Book Service/Longman; 1984.

Publication types