. 2009 Nov 22:10:59.
doi: 10.1186/1471-2172-10-59.

Induction of granzyme B expression in T-cell receptor/CD28-stimulated human regulatory T cells is suppressed by inhibitors of the PI3K-mTOR pathway

Affiliations

Induction of granzyme B expression in T-cell receptor/CD28-stimulated human regulatory T cells is suppressed by inhibitors of the PI3K-mTOR pathway

Olga V Efimova et al. BMC Immunol. .

Abstract

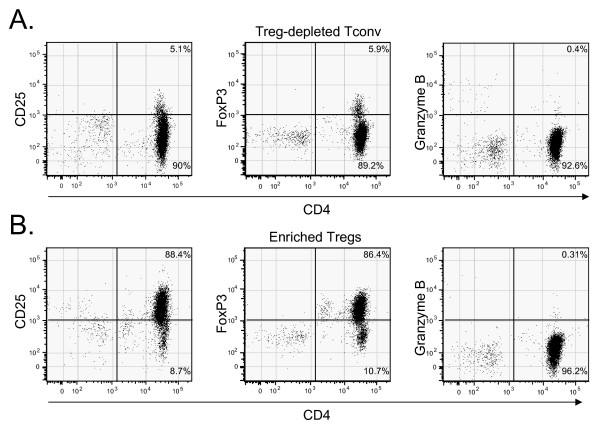
Background: Regulatory T cells (Tregs) can employ a cell contact- and granzyme B-dependent mechanism to mediate suppression of bystander T and B cells. Murine studies indicate that granzyme B is involved in the Treg-mediated suppression of anti-tumor immunity in the tumor microenvironment and in the Treg-mediated maintenance of allograft survival. In spite of its central importance, a detailed study of granzyme B expression patterns in human Tregs has not been performed.

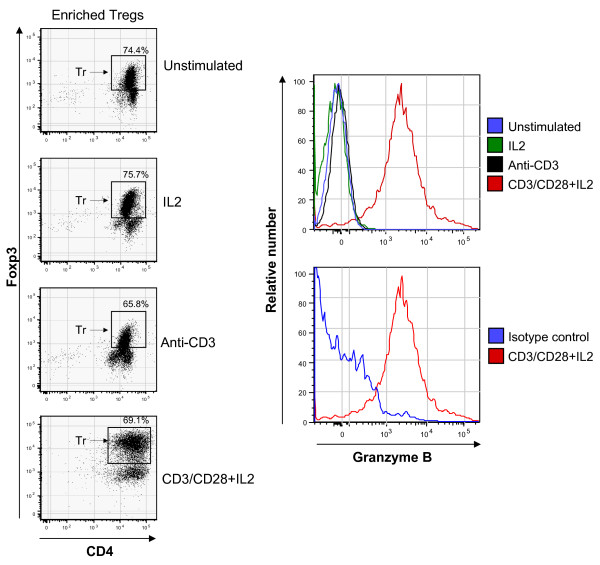
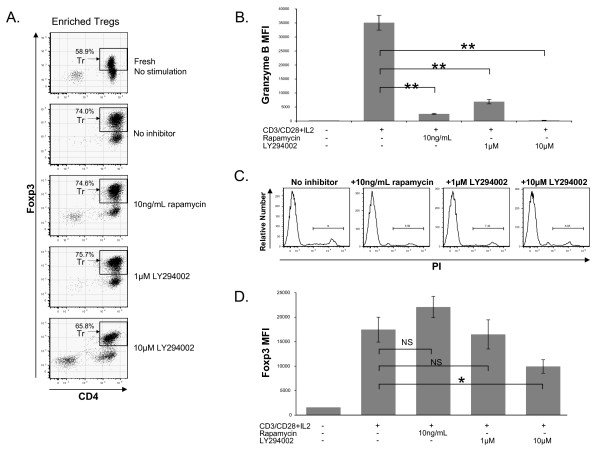
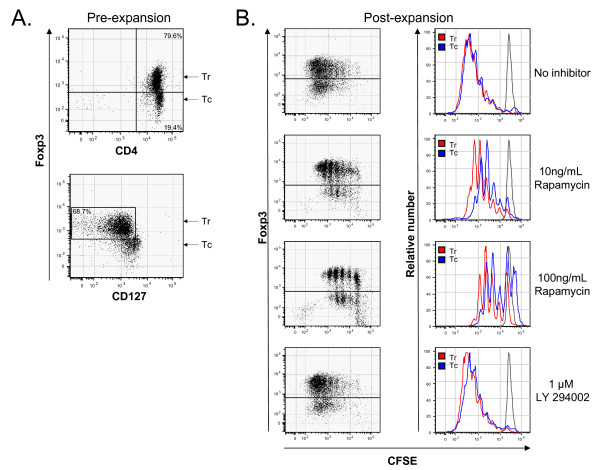
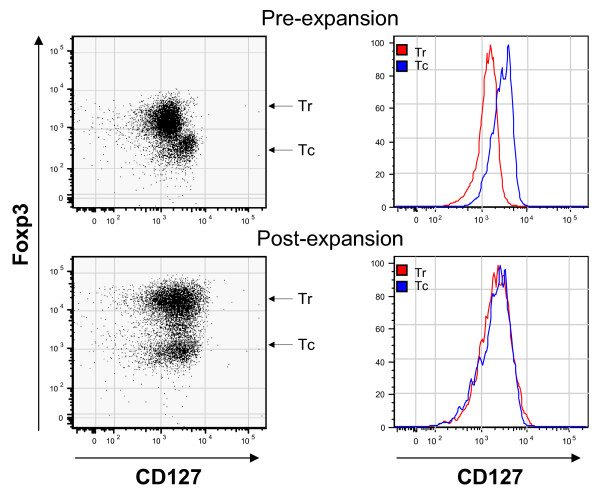
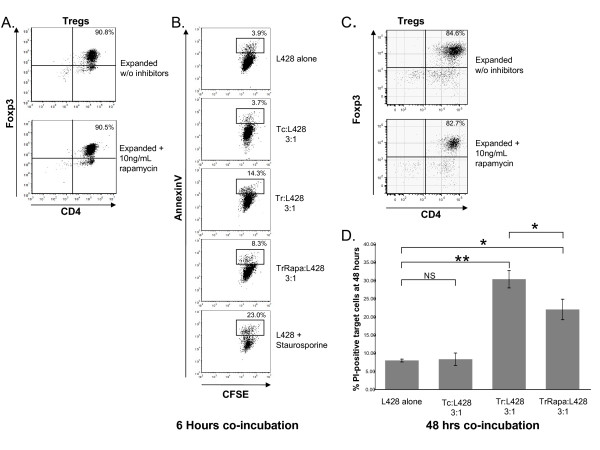
Results: Our data demonstrated that natural Tregs freshly isolated from the peripheral blood of normal adults lacked granzyme B expression. Tregs subjected to prolonged TCR and CD28 triggering, in the presence of IL-2, expressed high levels of granzyme B but CD3 stimulation alone or IL-2 treatment alone failed to induce granzyme B. Treatment of Tregs with the mammalian target of rapamycin (mTOR) inhibitor, rapamycin or the PI3 kinase (PI3K) inhibitor LY294002 markedly suppressed granzyme B expression. However, neither rapamycin, as previously reported by others, nor LY294002 inhibited Treg proliferation or induced significant cell death in TCR/CD28/IL-2 stimulated cells. The proliferation rate of Tregs was markedly higher than that of CD4+ conventional T cells in the setting of rapamycin treatment. Tregs expanded by CD3/CD28/IL-2 stimulation without rapamycin demonstrated increased in vitro cytotoxic activity compared to Tregs expanded in the presence of rapamycin in both short term (6 hours) and long term (48 hours) cytotoxicity assays.

Conclusion: TCR/CD28 mediated activation of the PI3K-mTOR pathway is important for granyzme B expression but not proliferation in regulatory T cells. These findings may indicate that suppressive mechanisms other than granzyme B are utilized by rapamycin-expanded Tregs.


Figures

Figure 1
Figure 1
CD4, CD25, granzyme B and FOXP3 expression patterns in freshly isolated Treg-depleted peripheral blood CD4+, CD25- conventional T cells (panel A) and enriched CD4+, CD25+ natural regulatory T cells (panel B). Utilizing a CD4/CD25 magnetic bead-based technique, the enriched samples of nTregs were routinely comprised of 60-70% Tregs based on FOXP3 expression. This data is representative of that seen in multiple subsequent experiments utilizing enriched Tregs. Similar results were obtained in 4 normal donors.
Figure 2
Figure 2
Granzyme B expression patterns by flow cytometry in enriched Tregs freshly isolated (unstimulated) or Tregs treated with IL-2 (250 IU/mL) or anti-CD3 coated beads (4:1 ratio of beads to cells) or anti-CD3/anti-CD28 coated beads (4:1 ratio of beads to cells) plus IL-2 (250 IU/ml) for 4 days. Granzyme B expression in the FOXP3+ gated Treg population at left (labeled Tr) is shown in histogram form at right (top right). For ease of comparison, the bottom right plot shows the level of staining of CD3/CD28/IL-2 stimulated cells with a granzyme B isotype control antibody. The data is representative of more than three experiments using multiple donors.
Figure 3
Figure 3
Granzyme B expression in Tregs analyzed by flow cytometric gating on FOXP3-bright cells (panel A, population labeled Tr) without stimulation or with stimulation by CD3/CD28 beads and IL-2 for 4 days without inhibitors (labeled no inhibitor) or with rapamycin (10 ng/mL) or the PI3K inhibitor LY294002 (1 or 10 μM). The data is graphed as mean of the mean fluorescence intensities (MFI) of granzyme B staining in the FOXP3-bright population in triplicate samples (panel B). Statistical comparison of the indicated data sets using a t-test is shown (** denotes P < .003). In order to confirm that the decrease in granzyme B expression was not attributable to induction of cell death in the rapamycin or LY294002-treated cells, samples were stained with propidium iodide (PI) (panel C). To facilitate interpretation, we next compared FOXP3 MFIs in the samples. The level of FOXP3 expression in the gated FOXP3-bright population (see panel A) in one unstimulated sample of Tregs (panel D, far left) and in triplicate stimulated samples treated with inhibitors as indicated is shown as a bar graph (panel D). Pairwise statistical comparisons are shown (NS-not significant with P > .05; * denotes P = .02). This data is representative of more than three experiments from multiple donors.
Figure 4
Figure 4
Treg-enriched peripheral blood CD4+ T cells containing approximately 80% Tregs (Tr) and 20% Tconv (Tc) were evaluated for expression of CD4, FOXP3 and CD127 prior to expansion (panel A). Samples were next labeled with CFSE then expanded for six days with CD3/CD28 beads and IL-2. Subsequently, samples were simultaneously evaluated for FOXP3 expression and CFSE staining intensity by flow cytometry. Dot plots showing proliferation in the FOXP3+ and FOXP3- fractions are shown in panel B along with an overlay of histograms for CFSE staining (Tregs are shown in red and Tconv are shown in blue). As a control a CFSE-labeled but unstimulated sample is shown in black. The data is representative of three similar experiments from multiple donors.
Figure 5
Figure 5
CD4+ peripheral blood T cells, enriched for Tregs but containing a population of Tconv, were evaluated by flow cytometry for CD127 and FOXP3 prior to expansion and after 4 days of expansion with CD3/CD28 beads and IL-2. A comparison of the level of CD127 staining is shown in the histograms (Tr = Tregs, Tc = Tconv). The data is representative of multiple experiments using different donors.
Figure 6
Figure 6
Fresh peripheral blood nTregs were purified based on flow cytometric sorting of the CD4+, CD25-bright T cell subset (brightest 1/3 of CD25+ cells; Figure 6A/B) or by a bead based method based on a CD4+, CD25+, CD127- surface antigen expression profile (Figure C/D) then expanded for four days with CD3/CD28 beads and IL-2 with and without 10 ng/mL rapamycin. Both isolation methods gave similar results. CD4 and FOXP3 expression were then evaluated on day 4 and showed relative purity of the resulting Treg populations (90.8% and 90.5% in panel A and 85% and 83% as indicated in panel C). Tregs were then co-cultured at a 3:1 ratio of Tregs (Tr = Tregs expanded without rapamycin; TrRapa = Tregs expanded with rapamycin) to CFSE labeled L428 target cells. Samples were plated in triplicate in media without additional stimuli or inhibitors. After 6 or 48 hours as indicated, apoptosis was assessed in the CFSE labeled L428 target cell population by flow cytometric evaluation of annexin-V binding (early apoptotic cells) or propidium iodide (PI) staining (late apoptotic cells) in the 6 and 48-hour assays, respectively (panels B and D). Control samples consisted of CFSE-labeled L428 cells alone, L428 cells alone exposed to 10 μM staurosporine (6 hour cytotoxicity assays only) and nonactivated Treg-depleted T cells (Tc) plated at a 3:1 ratio with labeled L428 target cells. Representative dot plots for a 6-hour cytotoxicity assay, with annexin-V positive apoptotic target cells highlighted with percentages, are shown in panel B. Replicates from a 48-hour cytotoxicity assays are graphed in panel D. Statistical comparison of the indicated data sets was performed using a t-test (NS-not significant with P > .05, * denotes P < .02, ** denotes P = .003). The data shown in both of the timepoints are representative of three experiments using multiple donors.

Similar articles

Cited by

References

    1. Miyara M, Sakaguchi S. Natural regulatory T cells: mechanisms of suppression. Trends Mol Med. 2007;13:108–16. doi: 10.1016/j.molmed.2007.01.003. - DOI - PubMed
    1. Zhao DM, Thornton AM, DiPaolo RJ, Shevach EM. Activated CD4+CD25+ T cells selectively kill B lymphocytes. Blood. 2006;107:3925–32. doi: 10.1182/blood-2005-11-4502. - DOI - PMC - PubMed
    1. Gondek DC, Lu LF, Quezada SA, Sakaguchi S, Noelle RJ. Cutting edge: contact-mediated suppression by CD4+CD25+ regulatory cells involves a granzyme B-dependent, perforin-independent mechanism. J Immunol. 2005;174:1783–6. - PubMed
    1. Cao X, Cai SF, Fehniger TA, Song J, Collins LI, Piwnica-Worms DR, Ley TJ. Granzyme B and perforin are important for regulatory T cell-mediated suppression of tumor clearance. Immunity. 2007;27:635–46. doi: 10.1016/j.immuni.2007.08.014. - DOI - PubMed
    1. Gondek DC, Devries V, Nowak EC, Lu LF, Bennett KA, Scott ZA, Noelle RJ. Transplantation survival is maintained by granzyme B+ regulatory cells and adaptive regulatory T cells. J Immunol. 2008;181:4752–60. - PMC - PubMed

MeSH terms