. 2010 Mar;138(3):1046-54.
doi: 10.1053/j.gastro.2009.11.043. Epub 2009 Nov 18.

Helicobacter pylori immune escape is mediated by dendritic cell-induced Treg skewing and Th17 suppression in mice

Affiliations

Helicobacter pylori immune escape is mediated by dendritic cell-induced Treg skewing and Th17 suppression in mice

John Y Kao et al. Gastroenterology. 2010 Mar.

Abstract

Background & aims: Helicobacter pylori infection increases gastric regulatory T cell (Treg) response, which may contribute to H pylori immune escape. We hypothesize that H pylori directs Treg skewing by way of dendritic cells (DCs) and thus inhibits interleukin-17(+) helper T cells (Th17) immunity.

Methods: Two-photon microscopy was used to locate DCs in gastric lamina propria of mice. The induction of Th17 and Treg responses by bacteria-pulsed murine bone marrow-derived DCs was analyzed by cytokine production and stimulation of T-cell proliferation. The effect of VacA, CagA, transforming growth factor-beta (TGF-beta), and IL-10 on Th17/Treg balance was assessed. The in vivo significance of Tregs on the H pylori-specific Th17 response and H pylori density was determined by using anti-CD25 neutralizing antibodies to deplete Tregs in mice.

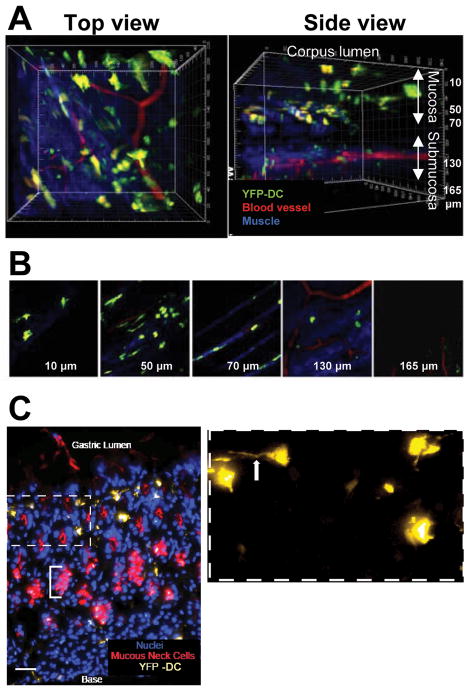
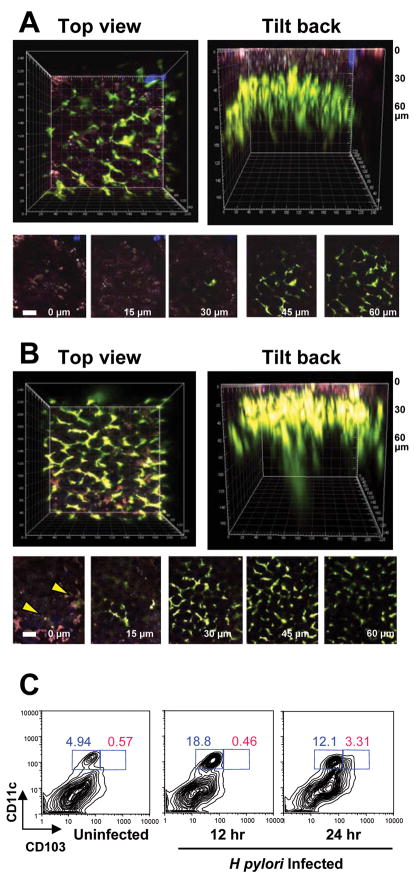
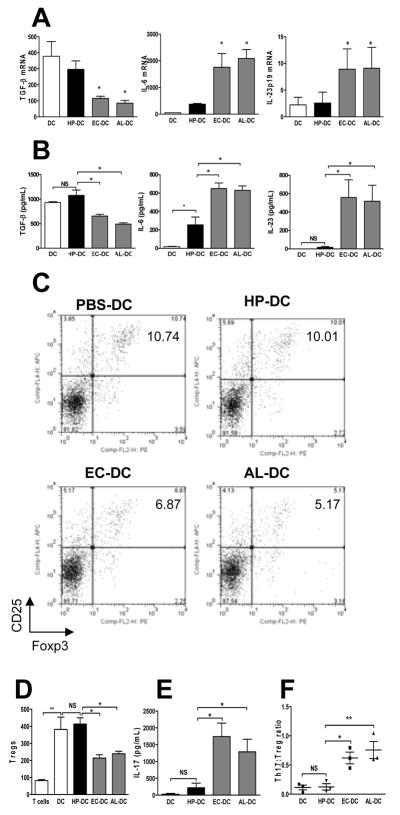
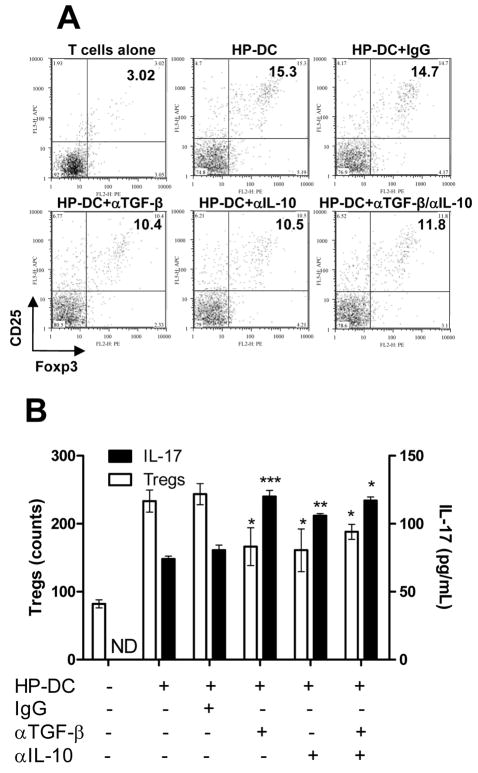
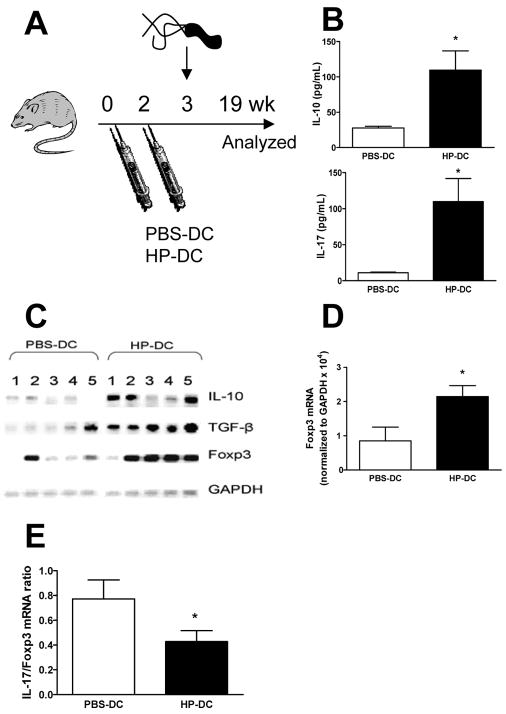
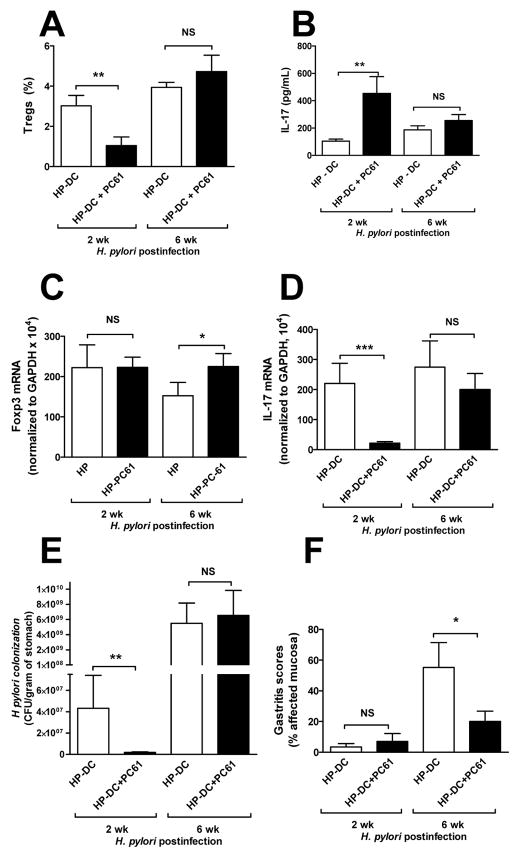
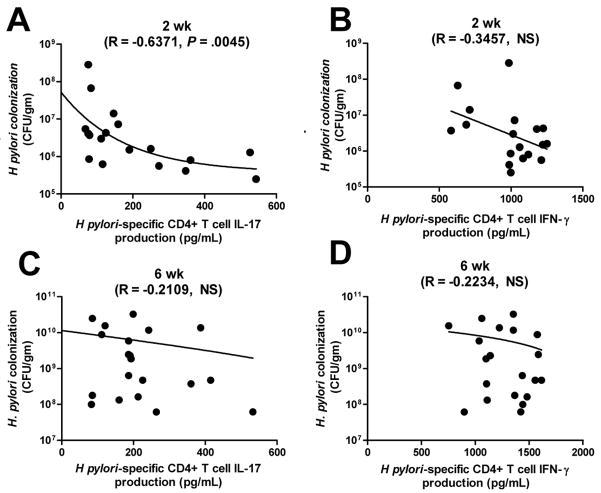
Results: We showed that mucosal CD11c(+) DCs are located near the surface of normal gastric epithelium, and their number increased after H pylori infection. Study of the direct interaction of DCs with H pylori showed a Treg-skewed response. The Treg skewing was independent of H pylori VacA and CagA and dependent on TGF-beta and IL-10. In vivo Treg skewing by adoptive transfer of H pylori-pulsed DCs reduces the ratio of gastric IL-17/Foxp3 mRNA expressions. The depletion of CD25(+) Tregs results in early reduction of H pylori density, which is correlated with enhanced peripheral H pylori-specific Th17, but not Th1, response.

Conclusions: Overall, our study indicates that H pylori alters the DC-polarized Th17/Treg balance toward a Treg-biased response, which suppresses the effective induction of H pylori-specific Th17 immunity.


Figures

Figure 1
Figure 1. Dendritic cells are found near the surface of the gastric mucosa
(A) A representative volume of the corpus of the stomach (220 × 240 × 177.5 μm, acquired in 71 2.5-μm steps) rendered in top, and side views imaged by two-photon microscopy. (B) Panels show single image planes taken from the z-stack at indicated depths. DCs (green) appear throughout the tissue. Large blood vessels (red) are visible above the muscle layer (blue striations); smaller vessels are visible at deeper levels. The blue likely represents a second harmonic generation signal emanating from collagen; it appears in several distinct strata from 50 μm to >130 μm. (C) Fresh-frozen section of a CD11c-YFP stomach shows corpus mucosa from the base of a gastric unit (i.e., lamina propria) to the lumen. Mucous neck cells, which are located immediately below the isthmal stem cell compartment, are visualized with GS-II lectin (pseudocolored red). YFP-tagged DCs (pseudocolored yellow) are visible in a region starting above the mucous neck cell zone and extending to the epithelial cells lining the surface. Bracket denotes the neck cell zone in one gastric unit. Inset: Higher magnification reveals dendritic extensions of the YFP-positive cells (arrow). Note: DCs correspond to the cells 10 μm below the surface in (B). Nuclei are counterstained with Hoechst (blue). Bar = 20 μm.
Figure 2
Figure 2. Increased gastric surface CD11c+ DCs during H pylori infection
DC 3D distribution in uninfected and H pylori infected CD11c-YFP mice were determined by two-photon microscopy. (A) In uninfected mice, a distinctive network of CD11c-YFP cells (green) was found ~30–40 μm below the luminal surface of the stomach corpus (identified by red-purple autofluorescence). In two separate experiments, we did not observe transepithelial DC extensions in uninfected mice. (B) In mice infected with H pylori 24 h previously, the number of CD11c-YFP cells appeared to increase and DCs were observed closer to the epithelium (identified by autofluorescence). We found DC extensions that appeared to probe the epithelial layer and in several cases, DC extended all the way though the epithelial layer to the mucosal surface as a billowing projection (yellow arrows). The image depth is shown in the bottom left corner of A and B. Scale bar equals 40 μm. (C) Increased numbers of CD11c+ DCs in mouse stomach after H pylori infection. Single cell prep of stomach from uninfected C57BL/6 mice or from mice infected with H pylori for 12 and 24 h were dual-labeled with PE-conjugated anti-mouse CD11c and APC-conjugated anti-mouse CD103 antibodies and analyzed by FACS. H pylori infection increased the number of CD11c+ DCs 12 h after infection with the emergence of CD103+ subset 24 h after infection.
Figure 3
Figure 3. Bone marrow–derived dendritic cells (DCs) maintain a low Th17:Treg ratio with H pylori stimulation
Bone marrow–derived DCs were pulsed with live H pylori, E coli, or A lwoffii for 18 h (denoted HP-DC, EC-DC, and AL-DC, MOI 1:100) and DC cytokine PCR-array was used to determine mRNA expressions of DC immunomodulatory genes (see Materials and Methods). Supernatants were collected and protein expression was measured by ELISA. (A) Comparison of TGF-β, IL-6, and IL-23p19 mRNA expressions of DCs using quantitative PCR. (B) Release of TGF-β, IL-6, and IL-23 by DCs was measured by ELISA. Messenger RNA and protein cytokine expressions indicate that lower levels of IL-6 and IL-23 were expressed by HP-DC compared with EC-DC and AL-DC. TGF-β production by DCs was similar in PBS-DC and HP-DC but reduced in EC-DC and AL-DC. A 72-h mixed leukocyte reaction using DCs and naive syngeneic splenocytes further assessed DC function in Treg and Th17 induction. (C) The percentage of CD4+CD25+Foxp3+ Tregs in the total number of CD4+ T cells was determined using FACS-generated dot plots. (D) The relative numbers of CD4+CD25+Foxp3+ Tregs from three separate experiments. (E) IL-17 production measured by ELISA. (F) The Th17:Treg ratio was calculated by dividing the number of IL-17 produced CD4+ cells by the number of Foxp3+ CD4+ cells measured using intracellular FACS staining. The Th17:Treg ratio was lower in HP-DC than in EC-DC and AL-DC (n = 3).
Figure 4
Figure 4. Neutralization of TGF-β and IL-10 decreased Treg induction and increased Th17 induction by HP-DC
Syngeneic naïve splenocytes cocultured for 72 h with HP-DC in the presence of PBS, control IgG, or neutralizing anti–TGF-β or anti–IL-10 antibodies separately or combined were stained for CD4+CD25+Foxp3+ Tregs. (A) Dot plot representation of CD25 and Foxp3 dual-labeled CD4+ T cells (gated on CD4+ cells). (B) Relative cell count of CD4+CD25+Foxp3+ Tregs and the Th17 response. IL-17 concentration was measured by ELISA. Blockade of TGF-β, IL-10, or combined TGF-β and IL-10 significantly reduced Treg priming and enhanced IL-17 release. (n = 3, P <.05 compared to IgG group).
Figure 5
Figure 5. Induction of H pylori–specific Treg response in vivo by adoptive transfer of HP-DC
C57BL/6 mice (n = 15 per group) were adoptively IP transferred with 106 PBS-DC or HP-DC on days 0 and 14 followed by H pylori SS1 oral challenge (108 CFU/mL) on day 21. Mice were sacrificed and analyzed after 19 wk. (A) Schematic representation of the animal study. (B) MACS-sorted splenic CD4+ T cells were stimulated ex vivo for 48 h in the presence of DCs and H pylori sonicate to examine H pylori–specific release of IL-10 and IL-17. (C) The mRNA expressions of IL-10, TGF-β, Foxp3, and the housekeeping gene GAPDH (glyceraldehyde 3-phosphate dehydrogenase) were compared using RT-PCR. (D) Quantitative PCR of stomach Foxp3 mRNA expressions. Increased expressions of stomach Foxp3 was observed in HP-DC mice compared to PBS-DC mice (n = 8 mice). (E) The IL17:Fopx3 mRNA expression ratio was calculated by dividing the mRNA expressions of gastric IL-17 by the mRNA expressions of gastric Foxp3. The Th17:Treg ratio was lower in HP-DC mice compared to PBS-DC mice ( P <.05 compared to PBS-DC group).
Figure 6
Figure 6. Treg depletion in HP-DC transferred mice enhances H pylori–specific Th17 response and is correlated with lower level of bacterial colonization
C57BL/6 mice (n = 10 per group) were injected IP with PBS or PC61 (anti-CD25 monoclonal antibody, 1 mg per mouse) on day 0. Mice were then immunized with HP-DC (106 cells per injection) on days 0 and 14. Mice were orally challenged with H pylori SS1 (108 organisms) three times in 1 wk starting on day 21. Mice were sacrificed on day 35 (2 wk postinfection) or given another IP injection of PC61 on day 30 and then sacrificed on day 65 (6 wk postinfection). (A) Percentages of CD4+CD25+ Tregs from splenocytes were determined by FACS. Treatment with PC61 reduced the percentage of Tregs in mouse spleen. (B) CD4+ T cells isolated from mouse spleens using MACS MicroBeads were stimulated with PBS or H pylori sonicate in the presence of unstimulated DCs. IL-17 concentrations were measured by ELISA. PC61 treatment significantly increased the production of H pylori–specific IL-17 by CD4+ T cells (n = 10 mice per group, * P <.05). (C-D) Gastric Foxp3 and IL-17 mRNA expressions are shown. (E) H pylori colonization was lower in PC61-treated mice. (F) Gastritis score was determined in a blinded fashion by Dr. Eaton.
Figure 7
Figure 7. Th17, not Th1, production is correlated with lower level of H pylori colonization in HP-DC transferred mice 2 wk postinfection
H pylori colonization was determined by quantitative PCR of H pylori–specific 16s rRNA and then correlated with H pylori–specific IFN-γ or IL-17 production. (A-B) Two wk postinfection. (C-D) Six wk postinfection. Correlations were compared. H pylori-specific IL-17 negatively correlated with H pylori colonization at 2 wk postinfection, not 6 wk postinfection.

References

    1. Perez-Perez GI, Dworkin BM, Chodos JE, et al. Campylobacter pylori antibodies in humans. Ann Intern Med. 1988;109:11–7. - PubMed
    1. Suerbaum S, Michetti P. Helicobacter pylori infection. N Engl J Med. 2002;347:1175–86. - PubMed
    1. Cooke CL, Huff JL, Solnick JV. The role of genome diversity and immune evasion in persistent infection with Helicobacter pylori. FEMS Immunol Med Microbiol. 2005;45:11–23. - PubMed
    1. Lundgren A, Suri-Payer E, Enarsson K, et al. Helicobacter pylori-specific CD4+ CD25high regulatory T cells suppress memory T-cell responses to H. pylori in infected individuals. Infect Immun. 2003;71:1755–62. - PMC - PubMed
    1. Raghavan S, Suri-Payer E, Holmgren J. Antigen-specific in vitro suppression of murine Helicobacter pylori-reactive immunopathological T cells by CD4CD25 regulatory T cells. Scand J Immunol. 2004;60:82–8. - PubMed

Publication types

MeSH terms