

Structure and dynamics of the actin filament
- PMID: 19931282
- PMCID: PMC2815099
- DOI: 10.1016/j.jmb.2009.11.034
Structure and dynamics of the actin filament
Abstract
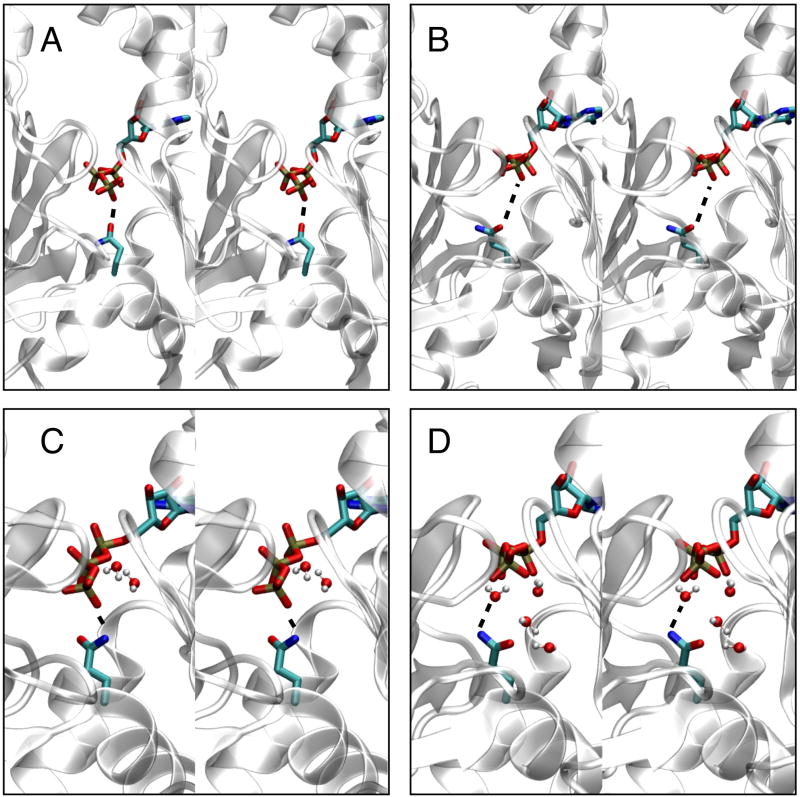
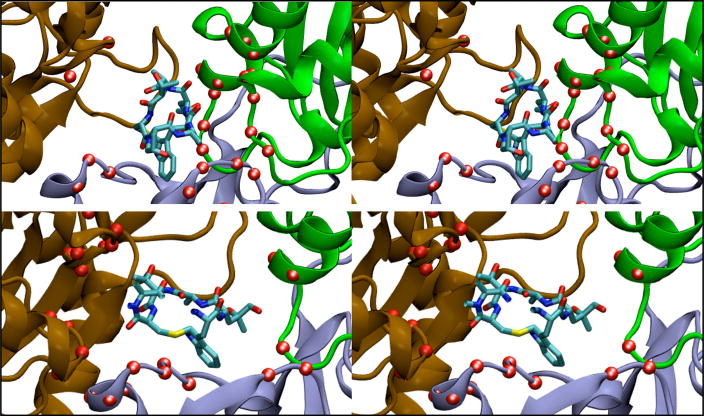
We used all-atom molecular dynamics simulations to investigate the structure and properties of the actin filament, starting with either the recent Oda model or the older Holmes model. Simulations of monomeric and polymerized actin show that polymerization changes the nucleotide-binding cleft, bringing together the Q137 side chain and bound ATP in a way that may enhance the ATP hydrolysis rate in the filament. Simulations with different bound nucleotides and conformations of the DNase I binding loop show that the persistence length of the filament depends only on loop conformation. Computational modeling reveals how bound phalloidin stiffens actin filaments and inhibits the release of gamma-phosphate from ADP-P(i) actin.
2009 Elsevier Ltd. All rights reserved.
Figures
Similar articles
-
Electrostatic interactions between the Bni1p Formin FH2 domain and actin influence actin filament nucleation.Structure. 2015 Jan 6;23(1):68-79. doi: 10.1016/j.str.2014.10.014. Epub 2014 Dec 4. Structure. 2015. PMID: 25482541 Free PMC article.
-
Allostery of actin filaments: molecular dynamics simulations and coarse-grained analysis.Proc Natl Acad Sci U S A. 2005 Sep 13;102(37):13111-6. doi: 10.1073/pnas.0503732102. Epub 2005 Aug 31. Proc Natl Acad Sci U S A. 2005. PMID: 16135566 Free PMC article.
-
Structural basis for polarized elongation of actin filaments.Proc Natl Acad Sci U S A. 2020 Dec 1;117(48):30458-30464. doi: 10.1073/pnas.2011128117. Epub 2020 Nov 16. Proc Natl Acad Sci U S A. 2020. PMID: 33199648 Free PMC article.
-
Actin polymerization: regulation by divalent metal ion and nucleotide binding, ATP hydrolysis and binding of myosin.Adv Exp Med Biol. 1994;358:71-81. doi: 10.1007/978-1-4615-2578-3_7. Adv Exp Med Biol. 1994. PMID: 7801813 Review.
-
The state of the filament.EMBO Rep. 2005 Mar;6(3):220-6. doi: 10.1038/sj.embor.7400363. EMBO Rep. 2005. PMID: 15741975 Free PMC article. Review.
Cited by
-
Coarse-graining provides insights on the essential nature of heterogeneity in actin filaments.Biophys J. 2012 Sep 19;103(6):1334-42. doi: 10.1016/j.bpj.2012.08.029. Biophys J. 2012. PMID: 22995506 Free PMC article.
-
Actin Filament Strain Promotes Severing and Cofilin Dissociation.Biophys J. 2017 Jun 20;112(12):2624-2633. doi: 10.1016/j.bpj.2017.05.016. Biophys J. 2017. PMID: 28636918 Free PMC article.
-
Ulipristal Acetate Interferes With Actin Remodeling Induced by 17β-Estradiol and Progesterone in Human Endometrial Stromal Cells.Front Endocrinol (Lausanne). 2018 Jun 27;9:350. doi: 10.3389/fendo.2018.00350. eCollection 2018. Front Endocrinol (Lausanne). 2018. PMID: 30013514 Free PMC article.
-
Principles of self-organization and load adaptation by the actin cytoskeleton during clathrin-mediated endocytosis.Elife. 2020 Jan 17;9:e49840. doi: 10.7554/eLife.49840. Elife. 2020. PMID: 31951196 Free PMC article.
-
Side-binding proteins modulate actin filament dynamics.Elife. 2015 Feb 23;4:e04599. doi: 10.7554/eLife.04599. Elife. 2015. PMID: 25706231 Free PMC article.
References
-
- Pollard TD, Blanchoin L, Mullins RD. Molecular mechanisms controlling actin filament dynamics in nonmuscle cells. Annu Rev Biophys Biomol Struct. 2000;29:545–576. - PubMed
-
- Geeves MA, Holmes KC. Structural mechanism of muscle contraction. Annu Rev Biochem. 1999;68:687–728. - PubMed
-
- Pollard TD. Regulation of actin filament assembly by Arp2/3 complex and formins. Annu Rev Biophys Biomol Struct. 2007;36:451–477. - PubMed
-
- Isambert H, Venier P, Maggs AC, Fattoum A, Kassab R, Pantaloni D, Carlier MF. Flexibility of actin filaments derived from thermal fluctuations. Effect of bound nucleotide, phalloidin, and muscle regulatory proteins. J Biol Chem. 1995;270:11437–11444. - PubMed
-
- Graceffa P, Dominguez R. Crystal structure of monomeric actin in the ATP state. J Biol Chem. 2003;278:34172–34180. - PubMed
Publication types
MeSH terms
Substances
Grants and funding
LinkOut - more resources
Full Text Sources
