

15N-NMR characterization of His residues in and around the active site of FeSOD
- PMID: 19931430
- PMCID: PMC6011655
- DOI: 10.1016/j.bbapap.2009.11.009
15N-NMR characterization of His residues in and around the active site of FeSOD
Abstract
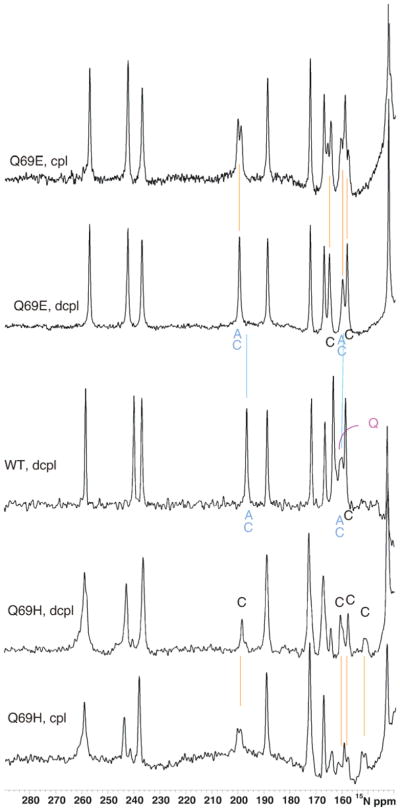
We have exploited (15)N-NMR to observe histidine (His) side chains in and around the active site of Fe-containing superoxide dismutase (FeSOD). In the oxidized state, we observe all the non-ligand His side chains and in the reduced state we can account for all the signals in the imidazole spectral region in terms of the non-ligand His', paramagnetically displaced signals from two backbone amides, and the side chain of glutamine 69 (Gln69). We also observe signals from the His' that ligate Fe(II). These confirm that neither the Q69H nor the Q69E mutation strongly affects the Fe(II) electronic structure, despite the 250 mV and >660 mV increases in E(m) they produce, respectively. In the Q69H mutant, we observe two new signals attributable to the His introduced into the active site in place of Gln69. One corresponds to a protonated N and the other is strongly paramagnetically shifted, to 500 ppm. The strong paramagnetic effects support the existence of an H-bond between His69 and the solvent molecule coordinated to Fe(II), as proposed based on crystallography. Based on previous information that His69 is neutral, we infer that the shifted N is not protonated. Therefore, we propose that this N represents a site of H-bond acceptance from coordinated solvent, representing a reversal of the polarity of this H-bond from that in WT (wild-type) FeSOD protein. We also present evidence that substrate analogs bind to Fe(II)SOD outside the Fe(II) coordination sphere, affecting Gln69 but without direct involvement of His30.
Copyright 2009 Elsevier B.V. All rights reserved.
Figures


Similar articles
-
How can a single second sphere amino acid substitution cause reduction midpoint potential changes of hundreds of millivolts?J Am Chem Soc. 2007 Aug 15;129(32):9927-40. doi: 10.1021/ja069224t. Epub 2007 Jul 12. J Am Chem Soc. 2007. PMID: 17628062
-
The crucial importance of chemistry in the structure-function link: manipulating hydrogen bonding in iron-containing superoxide dismutase.Biochemistry. 2006 Jan 31;45(4):1151-61. doi: 10.1021/bi051495d. Biochemistry. 2006. PMID: 16430211
-
Redox tuning over almost 1 V in a structurally conserved active site: lessons from Fe-containing superoxide dismutase.Acc Chem Res. 2008 Apr;41(4):501-10. doi: 10.1021/ar700237u. Epub 2008 Apr 1. Acc Chem Res. 2008. PMID: 18376853
-
Amino acid-specific isotopic labeling and active site NMR studies of iron(II)- and iron(III)-superoxide dismutase from Escherichia coli.J Biomol NMR. 2000 Aug;17(4):311-22. doi: 10.1023/a:1008344210662. J Biomol NMR. 2000. PMID: 11014595
-
Variations of the 2-His-1-carboxylate theme in mononuclear non-heme FeII oxygenases.Chembiochem. 2006 Oct;7(10):1536-48. doi: 10.1002/cbic.200600152. Chembiochem. 2006. PMID: 16858718 Review.
Cited by
-
Superoxide dismutases: ancient enzymes and new insights.FEBS Lett. 2012 Mar 9;586(5):585-95. doi: 10.1016/j.febslet.2011.10.048. Epub 2011 Nov 10. FEBS Lett. 2012. PMID: 22079668 Free PMC article. Review.
-
Engineering a dirhodium artificial metalloenzyme for selective olefin cyclopropanation.Nat Commun. 2015 Jul 24;6:7789. doi: 10.1038/ncomms8789. Nat Commun. 2015. PMID: 26206238 Free PMC article.
-
Examination of the Productivity and Physiological Responses of Maize (Zea mays L.) to Nitrapyrin and Foliar Fertilizer Treatments.Plants (Basel). 2021 Nov 10;10(11):2426. doi: 10.3390/plants10112426. Plants (Basel). 2021. PMID: 34834792 Free PMC article.
-
Combined QM/MM and Monte Carlo study for redox leveling in Mn and Fe superoxide dismutase.J Biol Inorg Chem. 2018 Mar;23(2):285-293. doi: 10.1007/s00775-017-1530-8. Epub 2017 Dec 27. J Biol Inorg Chem. 2018. PMID: 29282552
-
Superoxide dismutases and superoxide reductases.Chem Rev. 2014 Apr 9;114(7):3854-918. doi: 10.1021/cr4005296. Epub 2014 Apr 1. Chem Rev. 2014. PMID: 24684599 Free PMC article. Review. No abstract available.
References
-
- Miller A-F, Sorkin DL. Superoxide Dismutases: A Molecular Perspective. Comments in Molecular and Cellular Biophysics. 1997;9:1–48.
-
- Miller A-F. Fe-superoxide dismutase. In: Wieghardt K, Huber R, Poulos TL, Messerschmidt A, editors. Handbook of Metalloproteins. Wiley and Sons; Chichester: 2001. pp. 668–682.
-
- Wintjens R, Noël C, May ACW, Gerbod D, Dufernez F, Capron M, Viscogliosi E, Rooman M. Specificity and phenetic relationships of iron- and manganese-containing superoxide dismutases on the basis of structure and sequence. J Biol Chem. 2004;279:9248–9254. - PubMed
-
- Wintjens R, Gilis D, Rooman M. Mn/Fe superoxide dismutase interaction fingerprints and prediction of oligomerization and metal cofactor from sequence. Proteins, Str Func Bioinforat Online. 2007 Oct 2; - PubMed
-
- Fee JA, McClune GJ, Lees AC, Zidovetzki R, Pecht I. The pH Dependence of the Spectral and Anion Binding Properties of Iron Containing Superoxide Dismutase from E. Coli B: An Explanation for the Azide Inhibition of Dismutase Activity. Israel J Chem. 1981;21:54–58.
Publication types
MeSH terms
Substances
Grants and funding
LinkOut - more resources
Full Text Sources
