. 2009 Dec 15;19(23):2037-42.
doi: 10.1016/j.cub.2009.10.028.

Visualization of individual Scr mRNAs during Drosophila embryogenesis yields evidence for transcriptional bursting

Affiliations

Visualization of individual Scr mRNAs during Drosophila embryogenesis yields evidence for transcriptional bursting

Adam Paré et al. Curr Biol. .

Abstract

The detection and counting of transcripts within single cells via fluorescent in situ hybridization (FISH) has allowed researchers to ask quantitative questions about gene expression at the level of individual cells. This method is often preferable to quantitative RT-PCR, because it does not necessitate destruction of the cells being probed and maintains spatial information that may be of interest. Until now, studies using FISH at single-molecule resolution have only been rigorously carried out in isolated cells (e.g., yeast cells or mammalian cell culture). Here, we describe the detection and counting of transcripts within single cells of fixed, whole-mount Drosophila embryos via a combination of FISH, immunohistochemistry, and image segmentation. Our method takes advantage of inexpensive, long RNA probes detected with antibodies, and we present novel evidence to show that we can robustly detect single mRNA molecules. We use this method to characterize transcription at the endogenous locus of the Hox gene Sex combs reduced (Scr), by comparing a stably expressing group of cells to a group that only transiently expresses the gene. Our data provide evidence for transcriptional bursting, as well for divergent "accumulation" and "maintenance" phases of gene activity at the Scr locus.


Figures

Figure 1
Figure 1. The Scr expression pattern during mid-embryogenesis
(A) The Scr genomic locus, mRNA, and the locations of in situ probes used in this study. (B) A ventral view of a stage 11 Drosophila embryo showing Scr mRNA (red) and nuclei stained with DAPI (gray). The boundaries of parasegments 2 and 3 (PS2 and PS3) are indicated with dashed lines. The white box highlights the approximate areas shown in (C)–(H). (C–E) Expanded views of the area marked in (B) showing the boundary between PS2 and PS3 for: (C) a stage 10 embryo, (D) an early stage 11 embryo, and (E) a late stage 11 embryo. Transcripts are detected using FISH with a probe specific to the coding region of Scr (ORF probe). A high accumulation of Scr transcripts in PS2 is maintained throughout the three stages, while PS3 cells only highly accumulate Scr during early stage 11.
Figure 2
Figure 2. Competition for binding sites demonstrates that punctate signals represent single mRNA transcripts, and not groups of transcripts
(A) A ventral view of Scr transcript expression during early stage 11. Parasegmental boundaries are indicated with dashed lines. A region with high transcript levels, and a region not expressing Scr, are marked with white boxes, and are shown at high magnification in (B) and (C). (B) Scr FISH signals are punctate (arrow). Sites of nascent transcription appear as large, often irregularly shaped, nuclear signals (arrowhead). Nuclear boundaries are based on DAPI staining, and are indicated with gray lines. (C) Areas outside the region of Scr expression sometimes contain very weak fluorescent signals (arrow), which are also seen with no probe controls (see also Supplementary Figure 2). (D – F) Results from a triple-hybridization “competition assay”. FISH was carried out using the Scr ORF probe (D) and two differentially labeled unfragmented probes (S1 and S2) both complementary to the same region of the 3’ UTR (E, F). (G) A merge of (E) and (F) shows very little colocalization between the competing S1 and S2 probes. Most associated signals (arrows) can be attributed to sites of nascent transcription, where multiple RNAs are present in a small volume. (H) The Scr mRNA and the locations of FISH probes used in this assay. (I) A histogram summarizing the pair-wise associations between signals in the three fluorescent channels. “Association” is defined as significant overlap between signals in three dimensions. For example, the ‘S1→ORF’ bar refers to the percentage of time that an S1 signal overlaps with a signal from the ORF channel. ‘S1→S2 (rotated)’ refers to a control where an image stack from the S2 channel was rotated 90 degrees relative to the S1 channel, to simulate random association of signals. ‘S1→ORF & S2’ refers to cases of association in all three channels.
Figure 3
Figure 3. A combination of manual and automated image segmentation allows for counting transcripts within individual cells in complex tissues
(A) An image of Scr expressing cells in a region of PS2 from a stage 11 embryo. Cell membranes are marked by Spectrin staining (blue), nuclei are marked with DAPI (gray), and Scr transcripts are shown in red (ORF probe, Figure 1A). The segmented cell shown in (B)–(D) is indicated with a dashed line and arrow. (B) A surface rendering of the volume defined by manual segmentation for the cell highlighted in (A). (C) Scr probe signals from the segmented cell in (B). (D) A false color rendering of the signals in (C), which were segmented into individual objects. (E) An image of Scr expressing cells (ORF probe, Figure 1A) in PS2 and PS3 from a late stage 11 embryo. Cell membranes are marked by Spectrin staining (blue), Scr transcripts are shown in red, and segmented cells are depicted as solid white objects. The pair of cells highlighted in (H)–(J) are indicated with arrows, and the boundary between PS2 and PS3 is marked with a dashed line. (F) Nascent transcription detected with an intronic probe (Intron probe, Figure 1A) in the same embryo as shown in (E). (G) A schematic showing Scr transcript numbers and relative nascent transcription strength for three groups of cells. Red numbers represent total transcripts per cell and green numbers represent strength of nascent transcription (as the percentage of maximal intensity). Sites of nuclear transcription are represented as dots inside each cell. (H–J) A pair of neighboring cells with identical transcript concentrations exhibiting divergent transcriptional states. (H) Scr transcripts. (I) Nascent transcription. (J) A merge of (H) and (I).
Figure 4
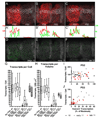
Figure 4. Analysis of Scr transcription at single cell resolution
(A–C) Scr expression in three embryos: (A) stage 10, (B) early stage 11, and (C) late stage 11. Scr transcripts are shown in red and cell membranes are marked in gray. Nuclei from the anterior compartment of each parasegment are stained for engrailed protein and appear as vertical gray stripes. The segmented cells analyzed in (G)–(J) are outlined in white. (A’–C’) Graphs showing cellular transcript numbers (red lines) and relative nascent transcription strength (green line, as a percentage of the maximum value) in the outlined cells plotted against cell centroid position. (D–F) The same embryos depicted in (A)–(C) stained with an intronic probe, showing sites of nascent transcription (green). (G) Boxplots summarizing transcripts per cell for various groups of cells. Boxes depict the median value and the middle two quartiles. Whiskers indicate the range of measurements, and the mean is shown as a dot inside each box. (H) A boxplot summarizing transcripts per volume (for ease of comparison to (G), values are shown with the units ‘transcripts/250µm3’, which is a typical cell volume) for various groups of cells. (I and J) Scatter diagrams plotting cellular transcript numbers against nascent transcription strength (as a percentage of maximum intensity) for PS2 and PS3 cells, respectively.

References

    1. Femino AM, Fay FS, Fogarty K, Singer RH. Visualization of single RNA transcripts in situ. Science (New York, N.Y.) 1998;280:585–590. - PubMed
    1. Raj A, Peskin CS, Tranchina D, Vargas DY, Tyagi S. Stochastic mRNA synthesis in mammalian cells. PLoS biology. 2006;4:e309. - PMC - PubMed
    1. Maamar H, Raj A, Dubnau D. Noise in gene expression determines cell fate in Bacillus subtilis. Science. 2007;317:526–529. - PMC - PubMed
    1. Raj A, van den Bogaard P, Rifkin SA, van Oudenaarden A, Tyagi S. Imaging individual mRNA molecules using multiple singly labeled probes. Nature methods. 2008;5:877–879. - PMC - PubMed
    1. Zenklusen D, Larson D, Singer R. Single-RNA counting reveals alternative modes of gene expression in yeast. Nat Struct Mol Biol. 2008;15:1263–1271. - PMC - PubMed

Publication types

MeSH terms

LinkOut - more resources