. 2010 Mar;24(3):409-19.
doi: 10.1016/j.bbi.2009.11.006. Epub 2009 Dec 4.

The effect of non-steroidal anti-inflammatory agents on behavioural changes and cytokine production following systemic inflammation: Implications for a role of COX-1

Affiliations

The effect of non-steroidal anti-inflammatory agents on behavioural changes and cytokine production following systemic inflammation: Implications for a role of COX-1

J L Teeling et al. Brain Behav Immun. 2010 Mar.

Abstract

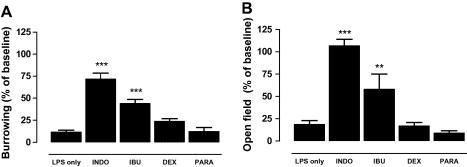
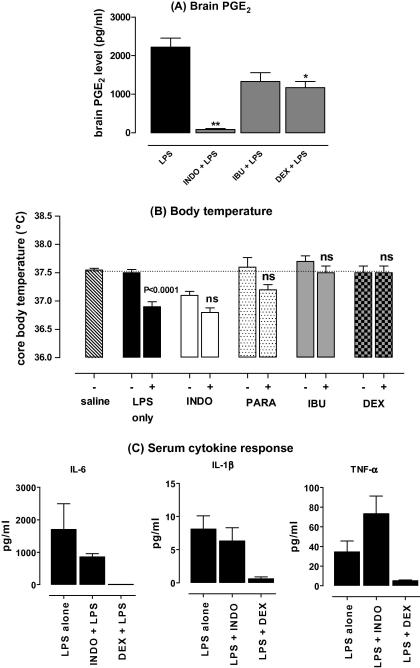
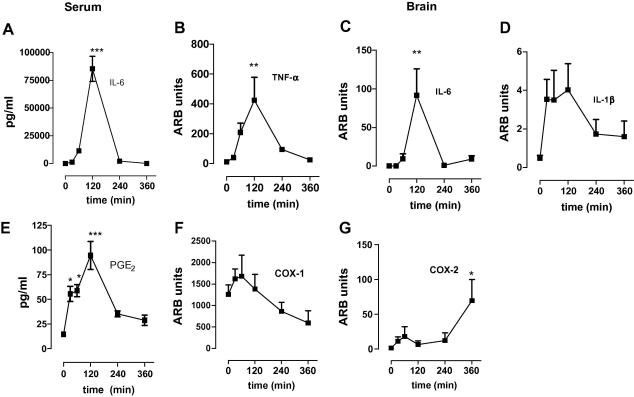
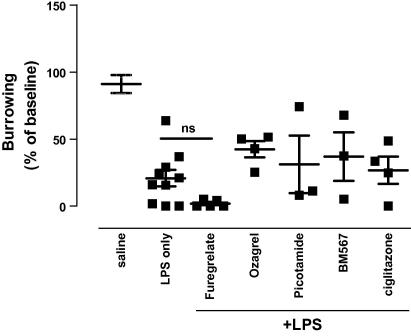
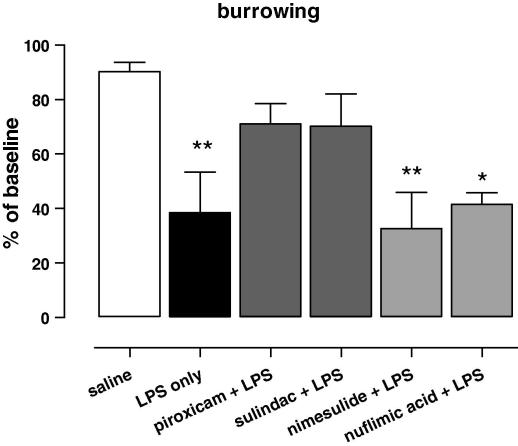
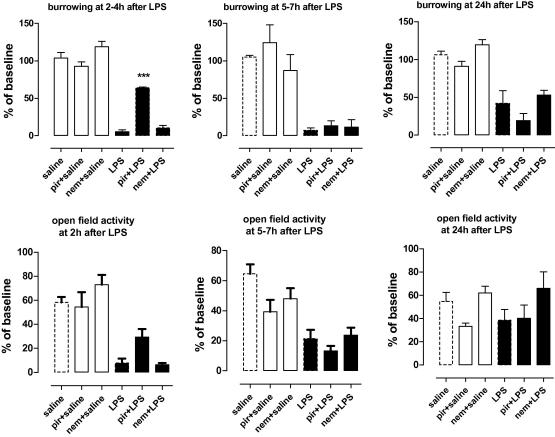
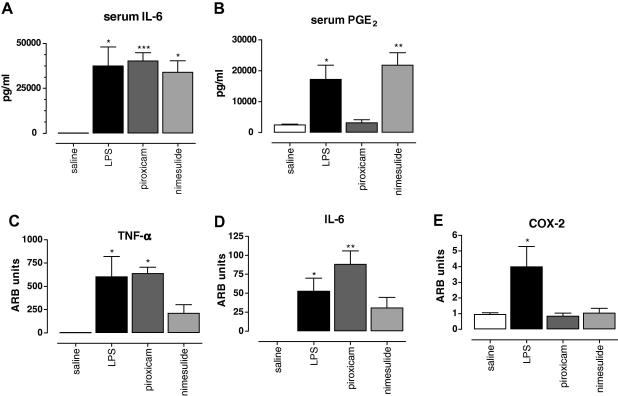
Systemic inflammation gives rise to metabolic and behavioural changes, largely mediated by pro-inflammatory cytokines and prostaglandin production (PGE(2)) at the blood-brain barrier. Despite numerous studies, the exact biological pathways that give rise to these changes remains elusive. This study investigated the mechanisms underlying immune-to-brain communication following systemic inflammation using various anti-inflammatory agents. Mice were pre-treated with selective cyclo-oxygenase (COX) inhibitors, thromboxane synthase inhibitors or dexamethasone, followed by intra-peritoneal injection of lipopolysaccharide (LPS). Changes in body temperature, open-field activity, and burrowing were assessed and mRNA and/or protein levels of inflammatory mediators measured in serum and brain. LPS-induced systemic inflammation resulted in behavioural changes and increased production of IL-6, IL-1beta and TNF-alpha, as well as PGE(2) in serum and brain. Indomethacin and ibuprofen reversed the effect of LPS on behaviour without changing peripheral or central IL-6, IL-1beta and TNF-alpha mRNA levels. In contrast, dexamethasone did not alter LPS-induced behavioural changes, despite complete inhibition of cytokine production. A selective COX-1 inhibitor, piroxicam, but not the selective COX-2 inhibitor, nimesulide, reversed the LPS-induced behavioural changes without affecting IL-6, IL-1beta and TNF-alpha protein expression levels in the periphery or mRNA levels in the hippocampus. Our results suggest that the acute LPS-induced changes in burrowing and open-field activity depend on COX-1. We further show that COX-1 is not responsible for the induction of brain IL-6, IL-1beta and TNF-alpha synthesis or LPS-induced hypothermia. Our results may have implications for novel therapeutic strategies to treat or prevent neurological diseases with an inflammatory component.


Figures

Fig. 1
Fig. 1
Effect of anti-inflammatory drugs on LPS-induced behavioural changes. Burrowing: (A) Mice were pre-treated with indomethacin (15 mg/kg), ibuprofen (15 mg/kg), dexamethasone (2 mg/kg) or paracetamol (20 mg/kg) given by intra-peritoneal (i.p.) injection. Thirty minutes later, LPS (500 μg/kg, i.p.) was administered and burrowing assayed over 2–4 h. Results were compared to baseline levels, which were obtained 24 h before the start of the experiment. Values are mean ± SEM. ∗∗∗p < 0.001 versus LPS alone. Data were analysed by one-way ANOVA followed by Dunnett’s test versus saline control. Open-field activity: (B) Mice were pre-treated with indomethacin (15 mg/kg), ibuprofen (15 mg/kg), dexamethasone (2 mg/kg) or paracetamol (20 mg/kg) given by intra-peritoneal (i.p.) injection. Thirty minutes later, LPS (500 μg/kg, i.p.) was administered and open-field activity measured between 3.5 and 4 h. Results were compared to baseline levels. Values are mean ± SEM. ∗∗∗p < 0.001 versus LPS alone. Data were analysed by one-way ANOVA followed by Dunnett’s test versus saline control. The total number of mice was n = 40 with LPS n = 20 and INDO, IBU, DEX and PARA each n = 5 per group.
Fig. 2
Fig. 2
Effect of NSAIDs on PGE2 production and fever response to LPS. (A) Effect of indomethacin, ibuprofen and dexamethasone pre-treatment on brain PGE2 protein expression levels measured in punches taken through the hypothalamus taken from brains 6 h after LPS challenge. Values are mean ± SEM. Data were analysed by one-way ANOVA followed by Dunnett’s post-test. The total number of mice used in this experiment was n = 25 mice; n = 13 for LPS only, n = 4 for NSAIDs p < 0.05 is considered significantly different. (B) Effect of indomethacin, ibuprofen and dexamethasone pre-treatment on body temperature following LPS administration. Body temperature was measured using a rectal probe as described in Section 2. Baseline temperature was recorded, prior to LPS or drug injection and the results compared to saline-treated mice. Values are mean ± SEM. Data were analysed by paired Student’s t-test, n = 5 mice per group. A total of 30 mice were used in this experiment. p < 0.05 is considered significantly different. (C) Effect of indomethacin and dexamethasone pre-treatment on circulating cytokine production in response to LPS. Serum samples were assessed for cytokines by ELISA as described in Section 2. Values are mean ± SEM. Data were analysed by paired Student’s t-test. p < 0.05 is considered significantly different. n = 20 for LPS-only treated mice, n = 5 for NSAIDs. LPS was given at a dose of 500 μg/kg, after pre-treatment of mice with indomethacin (INDO, 15 mg/kg), paracetamol (PARA, 20 mg/kg), ibuprofen (IBU, 15 mg/kg), dexamethasone (DEX, 2 mg/kg), or saline as control.
Fig. 3
Fig. 3
Kinetics of cytokine production in response to systemic immune challenge with LPS. (A) Effect of LPS (100 μg/kg) on expression levels of circulating IL-6 measured in serum samples taken at different time points following intra-peritoneal injection of LPS. Values are expressed as pg/ml, n = 5 mice per group. ∗∗∗p < 0.001, versus saline control (t = 0) with one-way ANOVA followed by Dunnett’s post-test versus saline control. (B) Effect of LPS (100 μg/kg i.p.) on relative brain mRNA expression levels of TNF-α (B), IL-6 (C) or IL-1β (D). Relative mRNA levels were measured in punches through the hippocampus taken from brain at different time points following intra-peritoneal injection of LPS. mRNA expression levels were measured by Taqman real time PCR using 40 amplification cycles. Values are relative to GAPDH expression and expressed as Arbitrary Units (ARB units). n = 5 mice per group; ∗p < 0.05 with one-way ANOVA following Dunnett’s post-test. (E) Effect of LPS (100 μg/kg) on expression levels of circulating PGE2 metabolites measured in serum samples taken at different time points following intra-peritoneal injection of LPS. Values are expressed as pg/ml n = 4 mice per group. ∗∗∗p < 0.001, versus saline control (t = 0) with one-way ANOVA followed by Dunnett’s post-test versus saline control. Effect of LPS (100 μg/kg) on relative brain mRNA expression levels of COX-1 (F) or COX-2 (G). Relative mRNA levels were measured in punches through the hippocampus taken from brain at different time points following intra-peritoneal injection of LPS. mRNA expression levels were measured by Taqman real time PCR. Values are relative to GAPDH expression and expressed as Arbitrary Units (ARB units). n = 5 mice per group; ∗p < 0.05 with one-way ANOVA following Dunnett’s post-test. A total of n = 30 mice was used in this experiment.
Fig. 4
Fig. 4
Role of thromboxane and PPAR-γ in LPS-induced behavioural changes. Mice were pre-treatment with an intra-peritoneal injection of furegrelate, picotamide, BM 567, ozagrel, ciglitazone or saline as described in Section 2, followed by a intra-peritoneal injection of LPS (100 μg/kg). Burrowing was assessed 1–3 h following LPS as described in Section 2. Values are mean ± SEM. ∗∗p < 0.01. One-way ANOVA followed by Dunnett’s post-test was used to analyse if behavioural changes were different from saline-treated mice. A total of 36 mice was used in this experiment: saline n = 8, LPS alone n = 8, furegrelate + LPS n = 5, ozagrel + LPS n = 4, picotamide + LPS n = 3, BM 567 + LPS n = 4, ciglitazone + LPS n = 4 per group.
Fig. 5
Fig. 5
Role of COX-1 and COX-2 in LPS-induced behavioural changes. Effect of the selective COX-1 inhibitors piroxicam (10 mg/kg) and sulindac (10 mg/kg), or the selective COX-2 inhibitors nimesulide (10 mg/kg) and nuflimic acid (10 mg/kg) pre-treatment on burrowing activity measured 1–3 h following intra-peritoneal injection of LPS. Values of behaviour are expressed as percentage of baseline ± SEM. One-way ANOVA followed by Dunnett’s post-test was used to analyse if behavioural changes were different from ‘saline-treated’ mice. A total of 26 mice were used in this experiment: saline n = 5, LPS alone n = 5, piroxicam + LPS n = 5, sulindac + LPS n = 3, nimesulide + LPS n = 5, nuflimic acid + LPS n = 3 per group. ∗p < 0.05, ∗∗p < 0.01.
Fig. 6
Fig. 6
Kinetics of COX-1 and COX-2 in LPS-induced behavioural changes. Effect of the selective COX-1 inhibitor piroxicam (10 mg/kg), or the selective COX-2 inhibitor nimesulide (10 mg/kg) on burrowing and open-field activity measured 1–3, 4–6 and 24 h following intra-peritoneal injection of LPS. COX inhibitors were given 30 min prior to LPS by intra-peritoneal administration. Values are expressed as percentage of base line ± SEM, n = 5 mice per group. ∗∗∗p < 0.0001. Data were analysed by two-way ANOVA followed by Bonferroni post-test. A total of 30 mice were used in this experiment.
Fig. 7
Fig. 7
Role of COX-1 and COX-2 in LPS-induced behavioural changes and inflammatory mediator production. Effect of the selective COX-1 inhibitor piroxicam (10 mg/kg), or the selective COX-2 inhibitor nimesulide (10 mg/kg) pre-treatment on expression levels of (A) circulating IL-6 measured in serum samples taken at 3 h following intra-peritoneal injection of LPS, (B) circulating PGE2 metabolites measured in serum samples taken at 3 h following intra-peritoneal injection of LPS, (E) relative levels of TNF-α mRNA copies, (F) relative levels of IL-6 mRNA copies, and (G) relative levels of COX-2 mRNA copies. mRNA was measured from punches through the hippocampus taken 3 h following intra-peritoneal injection of LPS. Values of circulating inflammatory mediators are expressed as mean pg/ml ± SEM, n = 4–5 mice per group. ∗p < 0.05 one-way ANOVA followed by Dunnett’s test compared to saline. mRNA expression levels were quantified by quantitative PCR using 40 amplification cycles. Values are relative to GAPDH expression and expressed as Arbitrary Units (ARB units). n = 5 mice per group; * indicated statistically different as compared to saline treatment ∗p < 0.05 with one-way ANOVA following Dunnett’s post-test. A total of 19 mice was used in this experiment: saline n = 4, LPS alone n = 5, picotamide + LPS n = 5, nimesulide n = 5 per group.

Comment in

Similar articles

Cited by

References

    1. Adcock I.M., Nasuhara Y., Stevens D.A., Barnes P.J. Ligand-induced differentiation of glucocorticoid receptor (GR) trans-repression and transactivation: preferential targetting of NF-kappaB and lack of I-kappaB involvement. Br. J. Pharmacol. 1999;127:1003–1011. - PMC - PubMed
    1. Aid S., Langenbach R., Bosetti F. Neuroinflammatory response to lipopolysaccharide is exacerbated in mice genetically deficient in cyclooxygenase-2. J. Neuroinflammation. 2008;5:17. - PMC - PubMed
    1. Aisen P.S. Evaluation of selective COX-2 inhibitors for the treatment of Alzheimer’s disease. J. Pain Symptom Manage. 2002;23:S35–S40. - PubMed
    1. Blatteis C.M. The onset of fever: new insights into its mechanism. Prog. Brain Res. 2007;162:3–14. - PubMed
    1. Bluthe R.M., Laye S., Michaud B., Combe C., Dantzer R., Parnet P. Role of interleukin-1beta and tumour necrosis factor-alpha in lipopolysaccharide-induced sickness behaviour: a study with interleukin-1 type I receptor-deficient mice. Eur. J. Neurosci. 2000;12:4447–4456. - PubMed

Publication types

MeSH terms