. 2010 Feb 15;494(2):130-7.
doi: 10.1016/j.abb.2009.11.019. Epub 2009 Nov 20.

Reactive oxygen and nitrogen species regulate inducible nitric oxide synthase function shifting the balance of nitric oxide and superoxide production

Affiliations

Reactive oxygen and nitrogen species regulate inducible nitric oxide synthase function shifting the balance of nitric oxide and superoxide production

Jian Sun et al. Arch Biochem Biophys. .

Abstract

Inducible NOS (iNOS) is induced in diseases associated with inflammation and oxidative stress, and questions remain regarding its regulation. We demonstrate that reactive oxygen/nitrogen species (ROS/RNS) dose-dependently regulate iNOS function. Tetrahydrobiopterin (BH4)-replete iNOS was exposed to increasing concentrations of ROS/RNS and activity was measured with and without subsequent BH4 addition. Peroxynitrite (ONOO(-)) produced the greatest change in NO generation rate, approximately 95% decrease, and BH4 only partially restored this loss of activity. Superoxide (O2(.-)) greatly decreased NO generation, however, BH4 addition restored this activity. Hydroxyl radical ((.)OH) mildly decreases NO generation in a BH4-dependent manner. iNOS was resistant to H2O2 with only slightly decreased NO generation with up to millimolar concentrations. In contrast to the inhibition of NO generation, ROS enhanced O2(.-) production from iNOS, while ONOO(-) had the opposite effect. Thus, ROS promote reversible iNOS uncoupling, while ONOO(-) induces irreversible enzyme inactivation and decreases both NO and O2(.-) production.


Figures

Figure 1
Figure 1. H2O2, .OH, O2.− and ONOO decrease iNOS NO generation
iNOS was pre-exposed to 50 μM total H2O2, .OH, O2.− (100 μM xanthine–0.1 unit/ml XO) or ONOO at room temperature for 10 min. EPR spin trapping measurements of NO production from iNOS were performed with 0.2 mM Fe–MGD in the presence of 2 mM 15N-L-arginine with 200 μM CaCl2, 10 μg/ml CaM, 1 mM NADPH. EPR spectra were acquired over with parameters as described in methods. Each oxidant treatment was performed in triplicate. The left panel shows representative spectra, exhibiting the characteristic doublet signal of the 15NO-Fe-MGD adduct. The right panel shows a graph of the mean ± SE value, n=3, of the measured NO adduct concentrations from each of the oxidant-treated iNOS samples.
Figure 2
Figure 2. Dose-dependent effect of ONOO and ROS on NO generation rate from iNOS
NO generation rate was measured using the oxyhemoglobin assay in 40 mM HEPES, pH 7.4, with 200 μM CaCl2, 10 μg/ml CaM, 150 μM DTT, 200 μM L-arginine and 50 μM oxyhemoglobin, with or without subsequent addition of 100 μM BH4. 200 μM NADPH was added to start the reaction. A, BH4 saturated iNOS (1 μM) was incubated with ONOO (0-500 μM) through infusion, 4 l/min for 5 min at 4°C. B, BH4 saturated iNOS (1 μM) was incubated with the O2.− generation system, xanthine (0-1000 μM) – XO (0.1unit/ml) – catalase (20 unit/ml), for 20 min at room temperature. O2.− produced from xanthine-XO was quantitated using the cytochrome c reduction assay and the concentration of O2.− generated corresponded to ~50% of the xanthine concentration. Control experiments were performed to assure that the O2.− production from xanthine-XO was completed within 20 min at room temperature. C, BH4 saturated iNOS (1 μM) was incubated with 10 μM Fe-NTA and increasing concentrations of H2O2 (0-500 μM) for 20 min on ice and 20 unit/ml catalase was added to remove the residual H2O2 before the assay. D, BH4 saturated iNOS (1 μM) was incubated with 100 μM DTPA and increasing concentrations of H2O2 (0-500 μM) for 20 min on ice and 20 unit/ml catalase was added to remove the residual H2O2 before the assay. The NO generation rates were calculated from the initial rates and are given as percentage of the activity of the un-treated iNOS. Data are presented as mean ± S.E. of triplicate experiments. X-axis is the oxidant concentration (μM) plotted in the log scale.
Figure 3
Figure 3. Effect of biological oxidants on O2.− generation rate from iNOS
BH4 saturated iNOS was incubated with each of the three ROS tested (0 - 500 μM) for 20 min. ONOO was infused into iNOS solution at 4 μl/min for 5min at 4°C. O2.− generation rate was then measured by EPR spin trapping. Each sample contained 40 μg/ml purified BH4–replete iNOS in 40 mM HEPES, pH 7.4, containing 20 unit/ml catalase, 200 μM DTPA, 200 μM CaCl2, 10 μg/ml CaM, 200 μM NADPH and 10 mM DIPPMPO. Results for treatment with ONOO (panel A), O2.− (panel B), .OH (panel C), and H2O2 (panel D) are given at each concentration as the mean ± S.E. of three independent measurements. X-axis is the oxidant concentration (μM) plotted in the log scale.
Figure 4
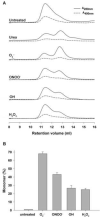
Figure 4. FPLC measurement of the oxidant-induced monomerization of iNOS
iNOS 25 μg was applied to each analysis. Elution buffer consisted of 50 mM Tris, 150 mM NaCl and 3 mM DTT, pH 7.4 at 6°C. Supedex 200 column and elution buffer were well equilibrated at ~6 °C. A, shows the chromatograms for untreated iNOS, 3 M urea-treated iNOS (3 M urea; 2 hours on ice), O2.−-treated iNOS (1000 μM xanthine; 0.1unit/ml XO; 20 min at RT), ONOO-treated iNOS (1000 μM ONOO; 10 min on ice), .OH-treated iNOS (1000 μM H2O2; 10 μM Fe-NTA; 20 min on ice), and H2O2-treated iNOS (1000 μM H2O2; 200 μM DTPA; 20 min on ice). Solid lines show the absorbance at 280 nm wavelength and the dashed lines the absorbance at 400 nm wavelength. B, shows a graph summarizing the results from a series of triplicate measurements. Each bar shows the percentage monomer for each condition.

Similar articles

Cited by

References

    1. Chu A, Chambers DE, Lin CC, Kuehl WD, Palmer RMJ, Moncada S, Cobb FR. J. Clin. Invest. 1991;87:1964–1968. - PMC - PubMed
    1. Bredt DS, Snyder SH. Neuron. 1992;8:3–11. - PubMed
    1. Ignarro LJ. Annu. Rev. Pharmacol. Toxicol. 1990;30:535–560. - PubMed
    1. Marletta MA, Tayeh MA, Hevel JM. Biofactors. 1990;2:219–225. - PubMed
    1. Knowles RG, Moncada S. Biochem. J. 1994;298:249–258. - PMC - PubMed

Publication types

LinkOut - more resources