. 2010 Jan 15:1310:87-102.
doi: 10.1016/j.brainres.2009.11.036. Epub 2009 Nov 22.

Phasic and tonic fluctuations in brain, muscle, and skin temperatures during motivated drinking behavior in rats: physiological correlates of motivation and reward

Affiliations

Phasic and tonic fluctuations in brain, muscle, and skin temperatures during motivated drinking behavior in rats: physiological correlates of motivation and reward

Michael S Smirnov et al. Brain Res. .

Abstract

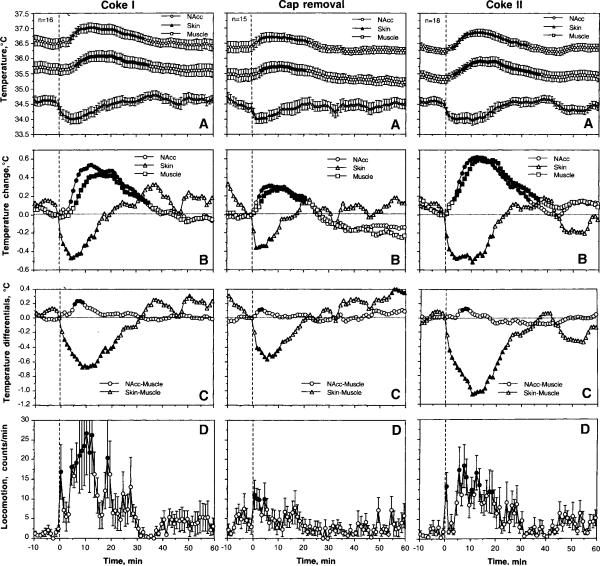
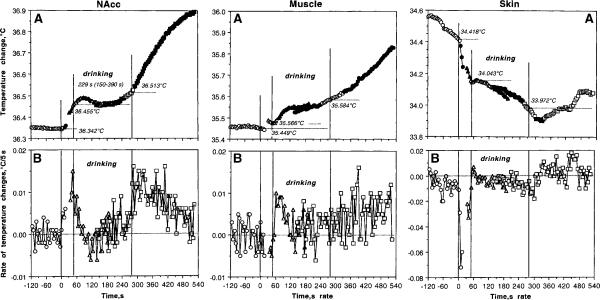
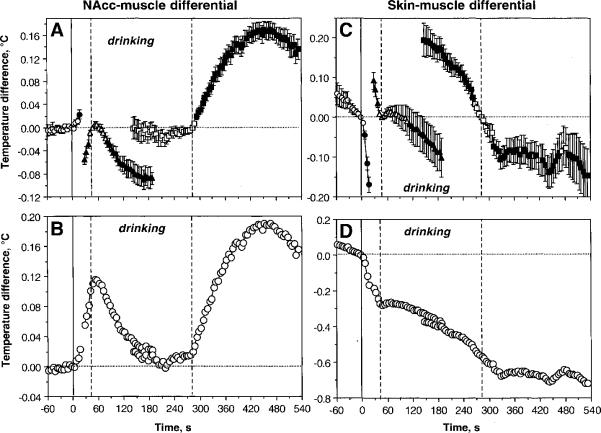
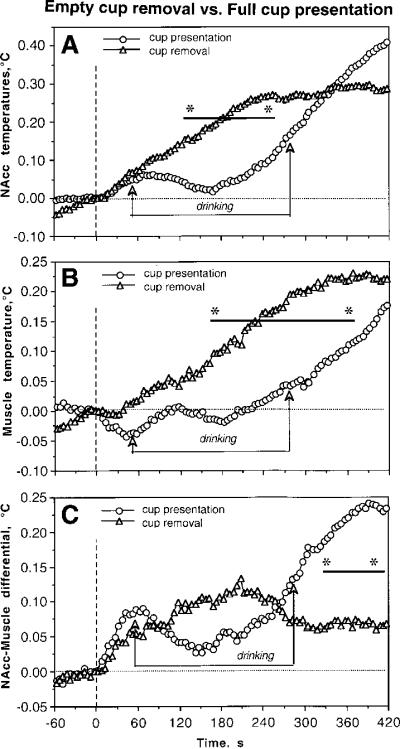
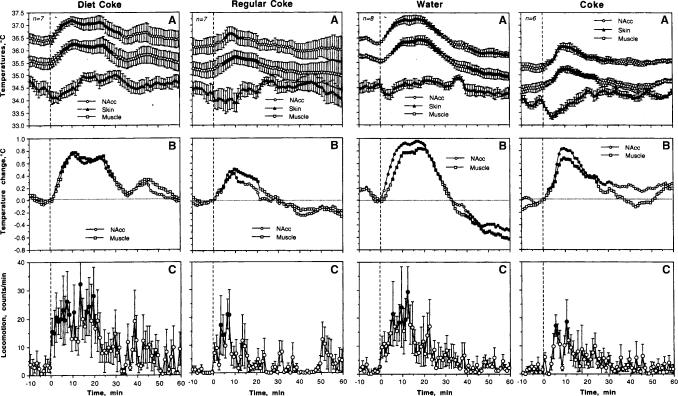
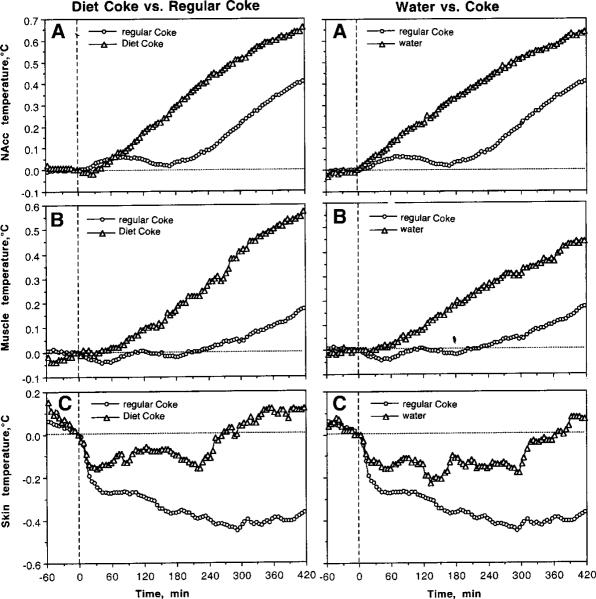
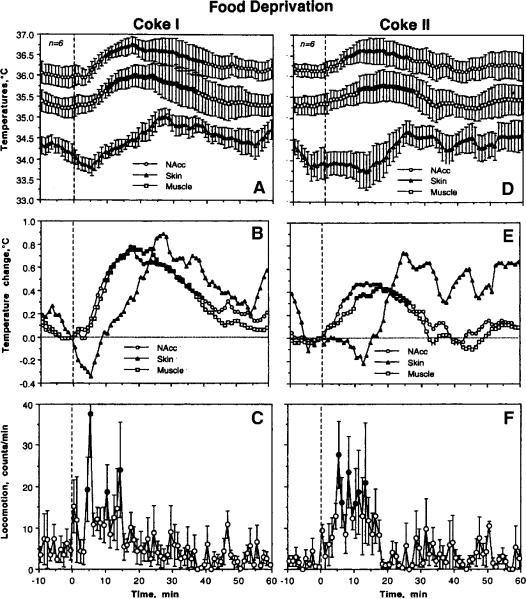
Since brain metabolism is accompanied by heat production, measurement of brain temperature offers a method for assessing global alterations in metabolic neural activity. This approach, high-resolution (5-s bin) temperature recording from the nucleus accumbens (NAcc), temporal muscle, and facial skin, was used to study motivated drinking behavior in rats. Experienced animals were presented with a cup containing 5-ml of Coca-Cola(R) (Coke) beverage that resulted, within certain latencies, in initiation of a continuous chain of licking until all liquid was fully consumed. While cup presentation induced rapid, gradual NAcc temperature increase peaking at the start of drinking, temperatures slowly decreased during Coke consumption, but phasically increased again in the post-consumption period when rats were hyperactive, showing multiple interactions with an empty cup. Muscle temperatures followed a similar pattern, but the changes were weaker and delayed compared to those in the brain. Skin temperature rapidly dropped after cup presentation, steadily maintained at low levels during consumption, and slowly restored during the post-consumption period. Substitution of the expected Coke with either sugar-free Diet Coke(R) or water resulted in numerous drinking attempts but ultimately no consumption. During these tests, locomotor activation was much greater and more prolonged, brain and muscle temperatures increased monophasically, and their elevation was significantly greater than that with regular Coke tests. Food deprivation decreased drinking latencies, did not change the pattern of temperature fluctuations during Coke consumption, but temperature elevations were greater than in controls. Our data suggest sustained neural activation triggered by appetitive stimuli and associated with activational (seeking) aspects of appetitive motivated behavior. This seeking-related activation is rapidly ceased following consumption, suggesting this change as a neural correlate of reward. In contrast, inability to obtain an expected reward maintains neural activation and seeking behavior, resulting in larger deviations in physiological parameters.


Figures

Fig. 1
Fig. 1
Mean changes in absolute (A) and relative temperatures (B), temperature differentials (C), and locomotion (D) following the first (left panel) and second (right panel) presentations of a Coke-filled cup, and removal of an empty cup (middle panel). n shows numbers of averaged tests and filled symbols show values significantly different from baseline. One-way ANOVA with repeated measures was used for statistical evaluation of temperatures and locomotion. F values for the first Coke test are: NAcc − F15,495=11.93; Skin − 6.50; Muscle − 11.79; locomotion − 1.56; at least p<0.05 each. F values for the second Coke test are: NAcc − F17,557=15.57; Skin − 9.00; Muscle − 14.14; locomotion − 1.82; at least p<0.01 each. F values cup removal are: NAcc − F14.464=6.36; Skin − 3.87; Muscle − 4.67; locomotion − 1.60; at least p<0.05 each.
Fig. 2
Fig. 2
The relationships between basal NAcc temperatures and their changes induced by cup presentation and its removal. For this analysis, all tests (n) with Coke presentation and removal (two from each session) were combined, and peak increases induced by both stimuli were represented vs. basal temperatures. In each case, amplitude of temperature elevation was negatively dependent on basal temperature. Both regression lines intersect with the line of no effect (=0, hatched) at higher brain temperature (~37.75 and 38.80°C for cup removal and presentation, respectively). r is a coefficient of correlation, which is highly significant for both tests.
Fig. 3
Fig. 3
Phasic changes in brain (left panel), muscle (central panel), and skin (right panel) temperatures associated with motivated drinking behavior. Top graphs (A) show absolute temperatures and bottom graphs (B) show rate of temperature changes. Three vertical lines in each graph mark the moments of full cup presentation, initiation of drinking behavior, and its end. Horizontal hatched lines in A show mean values of temperatures at the moment of each behavioral event. The hatched line in B shows zero change in temperature, i.e., no difference between each consecutive temperature value. Statistical evaluation was done separately for each of three events, with plus (following) and minus (preceding) time comparisons. Filled symbols show values statistically significant from reference points (either a 5-s value immediately preceding the start and end of drinking or the first 5-s value after these events). F values for cup presentation are: NAcc F32,164=4.88; p<0.001; Muscle=0.58, NS; Skin=52.42, p<0.001. F values for initiation of drinking: (1) preceding drinking onset: NAcc F32,164=36.46, p<0.001; Muscle=1.73, NS; Skin=16.18, p<0.001; (2) following drinking onset: NAcc F32,989=2.36; Muscle=15.05, Skin=4.28, each p<0.001. F values for changes following the end of drinking: (1) preceding end of drinking: NAcc F32,956=5.01; Muscle =6.34, Skin=9.44 (each p<0.001), p=0.59; skin-muscle differential =15.31 (p<0.001); (2) following drinking offset: NAcc F32,1022=57.13 (p<0.001), Muscle =20.17, Skin =2.93 (each p<0.001). While most changes are significant, note quantitative differences in F values that show the strength of the effect.
Fig. 4
Fig. 4
Mean changes in NAcc-muscle (A and B) and skin-muscle (C and D) temperature differentials during motivated drinking behavior. The changes are shown in two ways: with respect to the reference point of the behavioral event (Coke-containing cup presentation, initiation of drinking, and its end) set as zero (A and C) and with respect to the starting point (cup presentation) (B and D). Three vertical lines show, respectively, the moments of Coke-containing cup presentation (solid line=0 s), initiation of drinking (first hatched line), and its end (second hatched line). Similar to data shown in Fig. 3, statistical evaluation was done separately for each of three events, with plus (following) and minus (preceding) time comparisons. Filled symbols show values statistically significant from reference points. F values for cup presentation are: NAcc-muscle differential F32,164=5.88; skin-muscle differential = 57.40 (both p<0.001). F values for initiation of drinking: (1) preceding drinking onset: NAcc-muscle differential F32,164=23.99, skin-muscle differential =16.18 (both p<0.001); (2) following drinking onset: NAcc-muscle differential F32,956=22.46; skin-muscle differential 4.67 (both p<0.001). F values for changes following the end of drinking: (1) preceding end of drinking: NAcc-muscle differential =F32,956=0.59, p=0.59; skin-muscle differential =15.31 (p<0.001); (2) following drinking offset: NAcc-muscle differential F32,1022=57.13 (p<0.001), skin-muscle differential =2.86 (p<0.01). While most changes are significant, note quantitative differences in F values that show the strength of the effect.
Fig. 5
Fig. 5
Differences in high-speed temperature dynamics in the NAcc (A), temporal muscle (B), and NAcc-muscle temperature differentials (C) associated with presentation of Coke-filled cup and subsequent removal of the empty cup. Vertical hatched line at time=0 s shows the moments of cup presentation and removal. Two lines with arrows show the duration of drinking after full cup presentation. Bold lines with asterisks show intervals where between-group differences in each parameter were significant (p<0.05, Student's t-test).
Fig. 6
Fig. 6
Mean changes in absolute (A) and relative (B) temperatures, and locomotion (C) following presentation of Diet Coke with a subsequent test with regular Coke (two left panels) and following presentation of water with a subsequent test with regular Coke (two right panels). n shows numbers of averaged tests and filled symbols show values significantly different from baseline. One-way ANOVA with repeated measures was used for statistical evaluation of temperatures and locomotion. F values for Diet Coke presentation were: NAcc - F6,216=2.94; Skin=10.78, Muscle=2.57; each at least p<0.01; locomotion=0.79, NS. F values for Coke presentation after a Diet Coke: NAcc - F4.154=2.49, Muscle=2.89, Skin=2.80, p<0.01 each; locomotion=1.55, p<0.05. F values for water presentation: NAcc - F7,247=8.77; Skin=2.08, Muscle=9.17; each at least p<0.001; locomotion=1,16, NS. F values for Coke presentation after water: NAcc - F5.185=12.34, Muscle=6.14, Skin=6.38, p<0.001 each; locomotion=1.40, p=0.09.
Fig. 7
Fig. 7
Differences in phasic changes in brain (A), muscle (B), and skin (C) temperatures associated with Coke substitution to Diet Coke (left panel) or water (right panel). Each graph shows two curves, representing relative temperature changes (5-s bins) following presentation of a regular Coke and its substitute. Hatched lines show zero time and zero temperature change.
Fig. 8
Fig. 8
Mean changes in absolute (A and D) and relative temperatures (B and E) in each recording location as well as in locomotion (C and F) following the first (left panel) and second (right panel) presentations of Coke-filled cup in food-deprived conditions. n show the numbers of averaged tests and filled symbols show values significantly different from baseline. One-way ANOVA with repeated measures was used for statistical evaluation of temperatures and locomotion. F values for the first Coke presentation: NAcc - F5.185=2.62, Muscle=3.32, Skin=10.28, p<0.01 each; locomotion=2.18, p<0.01. F values for the second Coke presentation: NAcc - F5.185=1.70, Muscle=1.67, Skin=6.40, p<0.02 each; locomotion=1.99, p<0.01.
Fig. 9
Fig. 9
Differences in phasic changes in brain (A), muscle (B), and skin (C) temperatures associated with Coke presentations in food-deprived and satiated conditions. Each graph shows three curves, representing relative temperature changes (5-s bins) after two (I and II) Coke presentations in food-deprived conditions and regular Coke presentation in control, satiated conditions. Hatched lines show zero time and zero temperature change.

Similar articles

Cited by

References

    1. Abrams R, Hammel HT. Hypothalamic temperature in unanesthetized albino rats during feeding and sleeping. Am. J. Physiol. 1964;206:641–646. - PubMed
    1. Altschule MD. Emotion and circulation. Circulation. 1951;3:444–454. - PubMed
    1. Bae DB, Brown PL, Kiyatkin EA. Procedure of rectal temperature measurement affects brain, muscle, skin and body temperatures and modulates the effects of intravenous cocaine. Brain Res. 2007;1154:61–70. - PMC - PubMed
    1. Baker M, Cronin M, Mountjoy D. Variability of skin temperature in the waking monkey. Am. J. Physiol. 1976;230:449–455. - PubMed
    1. Barbano MF, Cador M. Various aspects of feeding behavior can be partially dissociated in the rat by the incentive properties of food and the physiological state. Behav. Neurosci. 2005;119:1244–1253. - PubMed

Publication types

Substances