. 2010 Jan;38(3):1022-33.
doi: 10.1093/nar/gkp1045. Epub 2009 Nov 19.

Verification of specific G-quadruplex structure by using a novel cyanine dye supramolecular assembly: II. The binding characterization with specific intramolecular G-quadruplex and the recognizing mechanism

Affiliations

Verification of specific G-quadruplex structure by using a novel cyanine dye supramolecular assembly: II. The binding characterization with specific intramolecular G-quadruplex and the recognizing mechanism

Qianfan Yang et al. Nucleic Acids Res. 2010 Jan.

Abstract

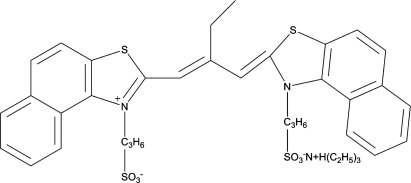
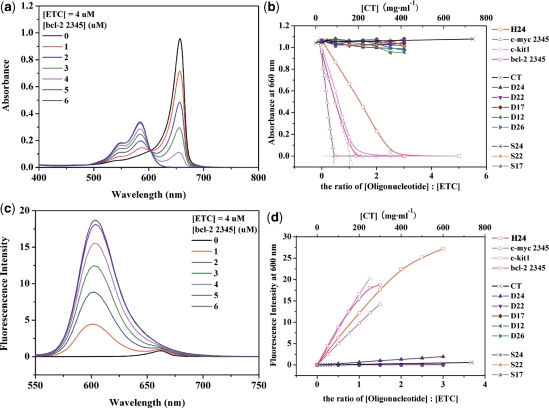
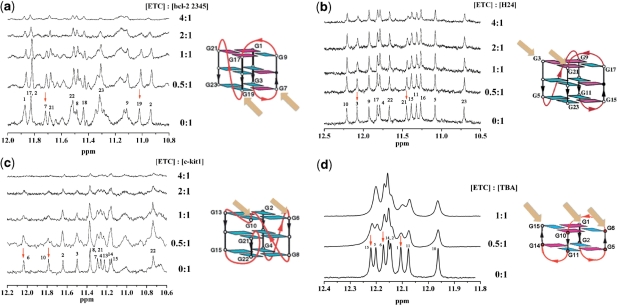
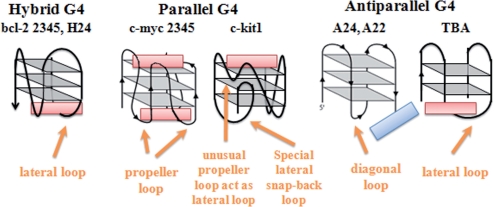
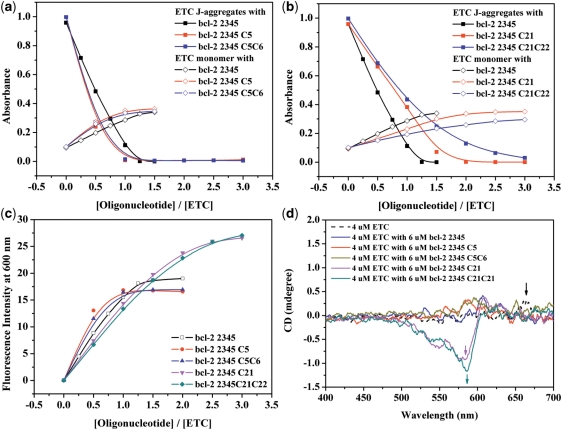
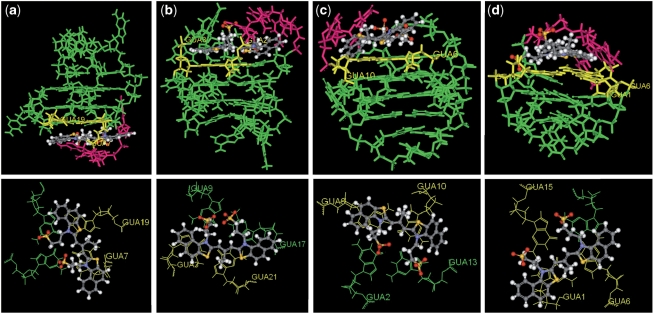
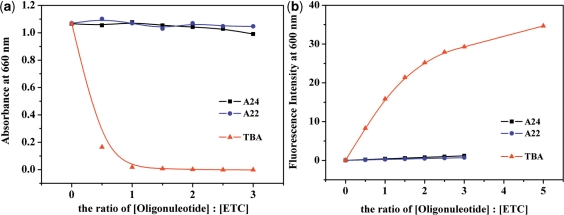
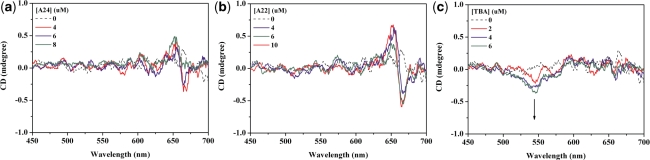
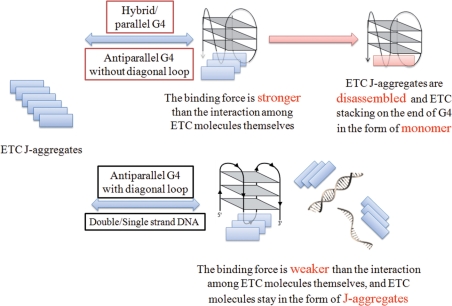
The supramolecular assembly of a novel cyanine dye, 3,3'-di(3-sulfopropyl)-4,5,4',5'-dibenzo-9-ethyl-thiacarbocyanine triethylammonium salt (ETC) was designed to verify specific intramolecular G-quadruplexes from duplex and single-strand DNAs. Spectral results have shown that ETC presented two major distinct signatures with specific intramolecular G-quadruplexes in vitro: (i) dramatic changes in the absorption spectra (including disappearance of absorption peak around 660 nm and appearance of independent new peak around 584 nm); (ii) approximately 70 times enhancement of fluorescence signal at 600 nm. Furthermore, based on (1)H-nuclear magnetic resonance and circular dichroism results, the preferring binding of ETC to specific intramolecular G-quadruplexes probably result from end-stacking, and the loop structure nearby also plays an important role.


Figures

Figure 1.
Figure 1.
The molecular formula of cyanine dye ETC.
Figure 2.
Figure 2.
The absorption (a) and fluorescence (c) spectra of 4-μM ETC with different concentrations of bcl-2 2345. The changes of 4 μM ETC J-aggregates absorbance (b) and monomer fluorescence intensity (d) against the ratio of [DNAs] : [ETC] and the concentration of CT (μg ml−1), respectively.
Figure 3.
Figure 3.
Recognition experiments on PAGE. Two-micromolar DNAs stained by SYBR Gold (lanes 1–11) and 10-μM DNAs by 20-μM ETC in PBS (K+) (lanes 12–22), respectively. Lanes 1–11 and 12–22 correspond to D24, D22, D17, D26, D12, S22, S17, S24, c-myc 2345, c-kit1 and bcl-2 2345, successively.
Figure 4.
Figure 4.
The CD spectra of 4-μM ETC (dashed lines) and 4-μM ETC with different concentrations of (a) bcl-2 2345; (b) H24; (c) c-kit1; and (d) c-myc 2345, respectively.
Figure 5.
Figure 5.
The 1H-NMR spectra of 200 μM (a) bcl-2 2345; (b) H24; (c) c-kit1; (d) TBA with different concentration of ETC (on the left side) and the NMR-based folding topologies of the DNAs (on the right side). The red arrows show the signals changed strongest and the orange ones show the corresponding binding sites.
Figure 6.
Figure 6.
The topologies of all kinds of G-quadruplexes, as well as the interaction between ETC molecule and them.
Figure 7.
Figure 7.
The changes of 4-μM ETC J-aggregates and monomer absorbance against the ratio of [bcl-2 2345 derivatives] : [ETC]: (a) bcl-2 2345, bcl-2 2345 C5 and bcl-2 2345 C5C6; (b) bcl-2 2345, bcl-2 2345 C21 and bcl-2 2345 C21C22. (c) The changes of 4-μM ETC monomer fluorescence intensity against the ratio of [bcl-2 2345 derivatives] : [ETC]. (d) The CD spectra of 4-μM ETC (dashed line) and 4-μM ETC with 6 μM various bcl-2 2345 derivatives.
Figure 8.
Figure 8.
The plots of the structure of (a) ETC-bcl-2 2345; (b) ETC-H24; (c) ETC-c-kit1 and (d) ETC-TBA complex from molecular mechanics simulation (on the top), and the top projections of the locations of ETC stacking onto the end G-tetrad (on the button). The binding sites based on 1H-NMR results are yellow and the lateral loops involved in the interaction are pink.
Figure 9.
Figure 9.
The changes of 4-μM ETC J-aggregates monomer absorbance (a) and monomer fluorescence intensity (b) against the ratio of [DNAs]: [ETC].
Figure 10.
Figure 10.
The CD spectra of 4-μM ETC (dashed lines) and 4-μM ETC with different concentrations of (a) A24; (b) A22; and (c) TBA, respectively.
Figure 11.
Figure 11.
The recognition mechanism of specific G-quadruplex by ETC supramolecular assembly compared with other DNA motifs.

Similar articles

Cited by

References

    1. Blackburn EH. Structure and function of telomeres. Nature. 1991;350:569–573. - PubMed
    1. Sen D, Gilbert W. Formation of parallel four-stranded complexes by guanine-rich motifs in DNA and its implications for meiosis. Nature. 1988;334:364–366. - PubMed
    1. Pennisi E. Genetics – DNA's; molecular gymnastics. Science. 2006;312:1467–1468. - PubMed
    1. Fu BQ, Huang J, Ren L, Weng XC, Zhou YY, Du YH, Wu XJ, Zhou X, Yang GF. Cationic corrole derivatives: a new family of G-quadruplex inducing and stabilizing ligands. Chem. Commun. 2007:3264–3266. - PubMed
    1. Zhou Q, Li L, Xiang J, Tang Y, Zhang H, Yang S, Li Q, Yang Q, Xu G. Screening potential antitumor agents from natural plant extracts by G-quadruplex recognition and NMR methods. Angew. Chem.-Int. Edit. 2008;47:5590–5592. - PubMed