

Intimal cushions and endothelial nuclear elongation around mouse aortic branches and their spatial correspondence with patterns of lipid deposition
- PMID: 19933414
- PMCID: PMC2822579
- DOI: 10.1152/ajpheart.00917.2009
Intimal cushions and endothelial nuclear elongation around mouse aortic branches and their spatial correspondence with patterns of lipid deposition
Abstract
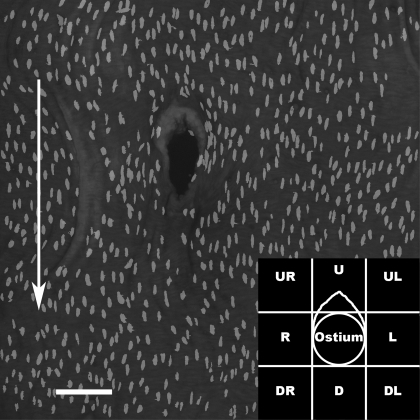
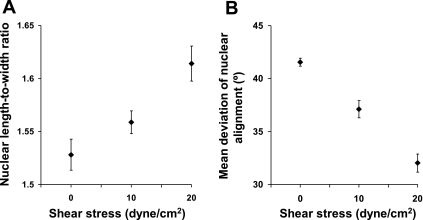
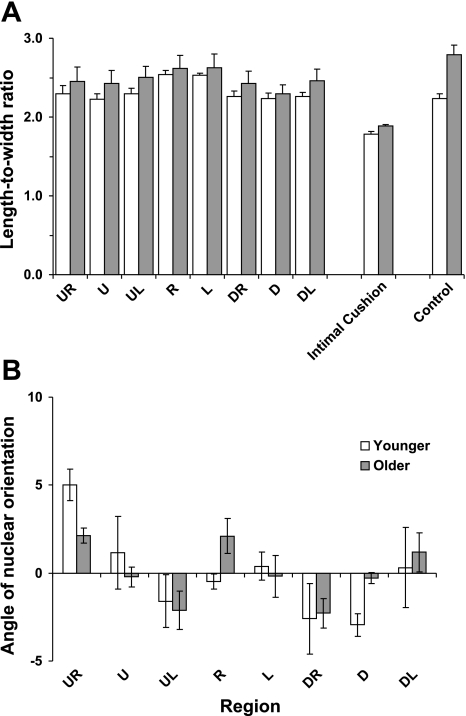
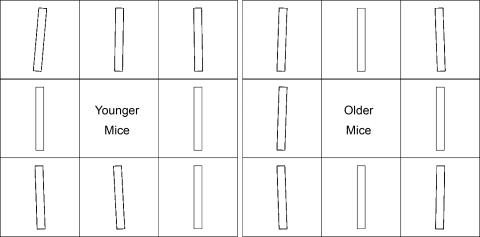
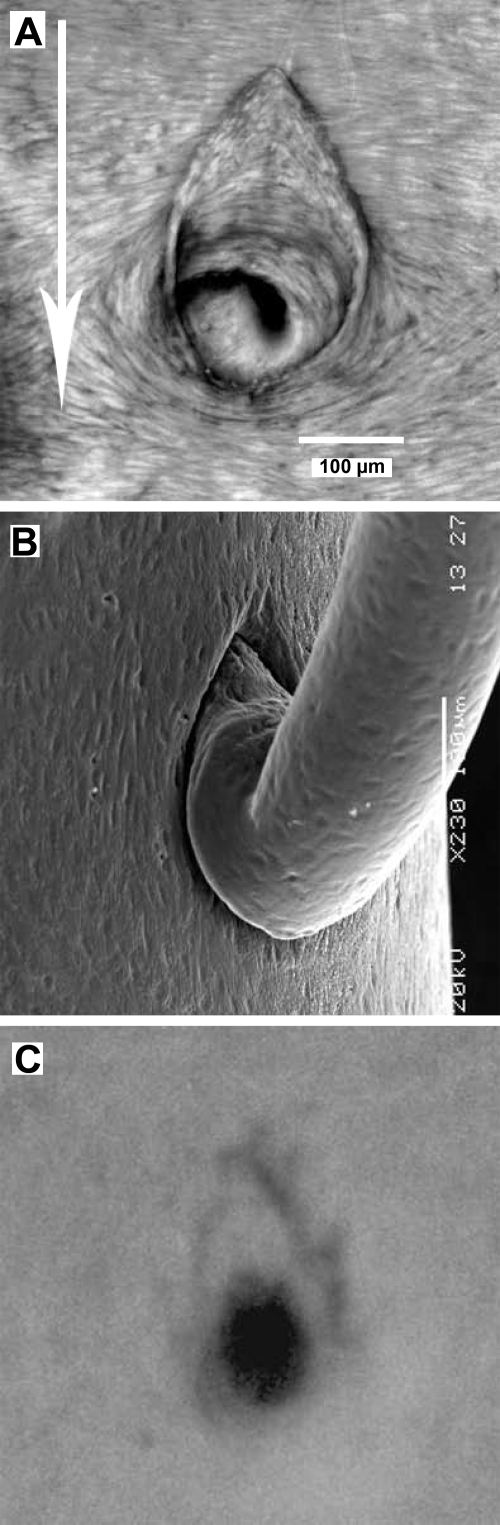
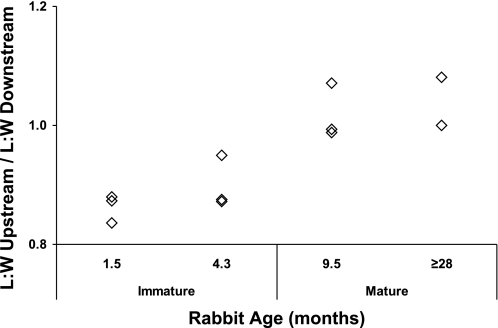
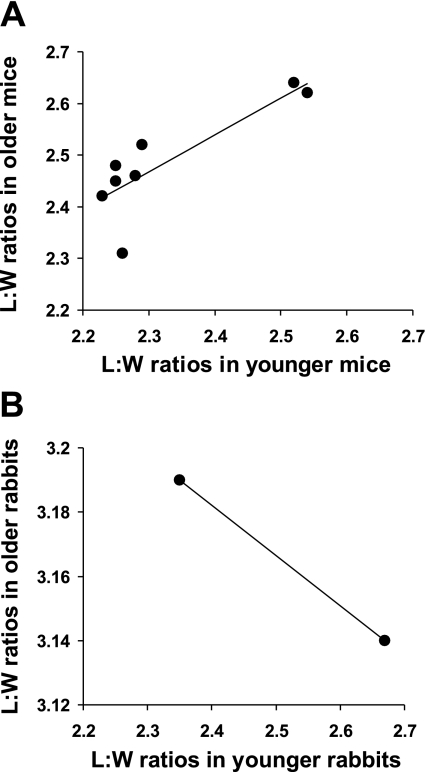
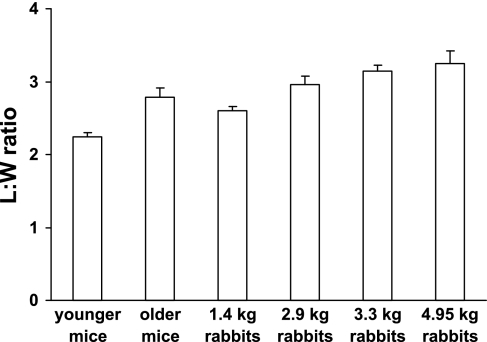
Spatial variation in hemodynamic stresses acting on the arterial wall may explain the nonuniform distribution of atherosclerosis. In thoracic aortas of LDL receptor/apolipoprotein E double knockout mice, lesions develop preferentially around the entire circumference of intercostal branch ostia, regardless of age, with the highest prevalence occurring upstream. Additional chevron-shaped lesions occur further upstream of the ostia. This pattern differs from the age-related ones occurring in people and rabbits. In the present study, patterns of near-wall blood flow around intercostal ostia in wild-type mice were estimated from the morphology of endothelial nuclei, which were shown in vitro to elongate in response to elevated shear stress and to align with the flow, and wall structure was assessed from confocal and scanning electron microscopy. A triangular intimal cushion surrounded the upstream part of most ostia. Nuclear length-to-width ratios were lowest over this cushion and highest at the sides of branches, regardless of age. Nuclear orientations were consistent with flow diverging around the branch. The pattern of nuclear morphology differed from the age-related ones observed in rabbits. The intimal cushion and the distribution of shear stress inferred from these observations can partly account for the pattern of lesions observed in knockout mice. Nuclear elongation in nonbranch regions was approximately constant across animals of different size, demonstrating the existence of a mechanism by which endothelial cells compensate for the dependence of mean aortic wall shear stress on body mass.
Figures
Similar articles
-
Effect of aortic taper on patterns of blood flow and wall shear stress in rabbits: association with age.Atherosclerosis. 2012 Jul;223(1):114-21. doi: 10.1016/j.atherosclerosis.2012.04.020. Epub 2012 May 15. Atherosclerosis. 2012. PMID: 22658260
-
Modulation of expression of endothelial intercellular adhesion molecule-1, platelet-endothelial cell adhesion molecule-1, and vascular cell adhesion molecule-1 in aortic arch lesions of apolipoprotein E-deficient compared with wild-type mice.Arterioscler Thromb Vasc Biol. 2000 Oct;20(10):2288-96. doi: 10.1161/01.atv.20.10.2288. Arterioscler Thromb Vasc Biol. 2000. PMID: 11031217
-
Patterns of vascular cell adhesion molecule-1 and intercellular adhesion molecule-1 expression in rabbit and mouse atherosclerotic lesions and at sites predisposed to lesion formation.Circ Res. 1999 Jul 23;85(2):199-207. doi: 10.1161/01.res.85.2.199. Circ Res. 1999. PMID: 10417402
-
Disease patterns at arterial branches and their relation to flow.Biorheology. 2002;39(3-4):533-7. Biorheology. 2002. PMID: 12122277 Review.
-
Hemodynamic parameters and early intimal thickening in branching blood vessels.Crit Rev Biomed Eng. 2001;29(1):1-64. doi: 10.1615/critrevbiomedeng.v29.i1.10. Crit Rev Biomed Eng. 2001. PMID: 11321642 Review.
Cited by
-
Microvascular anatomy of the non-lobulated liver of adult Xenopus laevis: A scanning electron microscopic study of vascular casts.Anat Rec (Hoboken). 2022 Feb;305(2):243-253. doi: 10.1002/ar.24649. Epub 2021 May 24. Anat Rec (Hoboken). 2022. PMID: 33943032 Free PMC article.
-
Angiotensin II induces DNA damage via AT1 receptor and NADPH oxidase isoform Nox4.Mutagenesis. 2012 Nov;27(6):673-81. doi: 10.1093/mutage/ges033. Epub 2012 Jul 27. Mutagenesis. 2012. PMID: 22844079 Free PMC article.
-
Atherogenic LOX-1 signaling is controlled by SPPL2-mediated intramembrane proteolysis.J Exp Med. 2019 Apr 1;216(4):807-830. doi: 10.1084/jem.20171438. Epub 2019 Feb 28. J Exp Med. 2019. PMID: 30819724 Free PMC article.
-
Microvascular anatomy of the urinary bladder in the adult African clawed toad, Xenopus laevis: A scanning electron microscope study of vascular casts.J Morphol. 2021 Mar;282(3):368-377. doi: 10.1002/jmor.21310. Epub 2020 Dec 25. J Morphol. 2021. PMID: 33368528 Free PMC article.
-
Characterizing nuclear morphology and expression of eNOS in vascular endothelial cells subjected to a continuous range of wall shear stress magnitudes and directionality.J Mech Behav Biomed Mater. 2023 Jan;137:105545. doi: 10.1016/j.jmbbm.2022.105545. Epub 2022 Oct 29. J Mech Behav Biomed Mater. 2023. PMID: 36368188 Free PMC article.
References
-
- Al-Musawi S, Bishton J, Dean J, Williams S, Cremers SG, Weinberg PD. Evidence for a reversal with age in the pattern of near-wall blood flow around aortic branches. Atherosclerosis 172: 79–84, 2004 - PubMed
-
- Balconi G, Spagnuolo R, Dejana E. Development of endothelial cell lines from embryonic stem cells: a tool for studying genetically manipulated endothelial cells in vitro. Arterioscler Thromb Vasc Biol 20: 1443–1451, 2000 - PubMed
-
- Barnes SE, Weinberg PD. Contrasting patterns of spontaneous aortic disease in young and old rabbits. Arterioscler Thromb Vasc Biol 18: 300–308, 1998 - PubMed
-
- Barnes SE, Weinberg PD. Two patterns of lipid deposition in the cholesterol-fed rabbit. Arterioscler Thromb Vasc Biol 19: 2376–2386, 1999 - PubMed
-
- Barnes SE, Weinberg PD. Strain-dependent differences in the pattern of aortic lipid deposition in cholesterol-fed rabbits. Exp Mol Pathol 71: 161–170, 2001 - PubMed
Publication types
MeSH terms
Grants and funding
LinkOut - more resources
Full Text Sources