. 2010 Feb;298(2):H699-718.
doi: 10.1152/ajpheart.00606.2009. Epub 2009 Nov 20.

Development of an anatomically detailed MRI-derived rabbit ventricular model and assessment of its impact on simulations of electrophysiological function

Affiliations

Development of an anatomically detailed MRI-derived rabbit ventricular model and assessment of its impact on simulations of electrophysiological function

Martin J Bishop et al. Am J Physiol Heart Circ Physiol. 2010 Feb.

Abstract

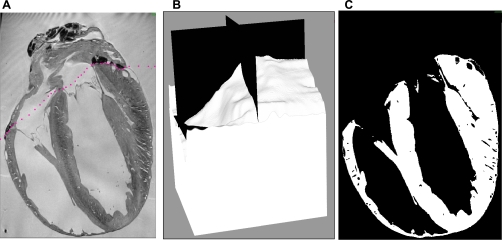
Recent advances in magnetic resonance (MR) imaging technology have unveiled a wealth of information regarding cardiac histoanatomical complexity. However, methods to faithfully translate this level of fine-scale structural detail into computational whole ventricular models are still in their infancy, and, thus, the relevance of this additional complexity for simulations of cardiac function has yet to be elucidated. Here, we describe the development of a highly detailed finite-element computational model (resolution: approximately 125 microm) of rabbit ventricles constructed from high-resolution MR data (raw data resolution: 43 x 43 x 36 microm), including the processes of segmentation (using a combination of level-set approaches), identification of relevant anatomical features, mesh generation, and myocyte orientation representation (using a rule-based approach). Full access is provided to the completed model and MR data. Simulation results were compared with those from a simplified model built from the same images but excluding finer anatomical features (vessels/endocardial structures). Initial simulations showed that the presence of trabeculations can provide shortcut paths for excitation, causing regional differences in activation after pacing between models. Endocardial structures gave rise to small-scale virtual electrodes upon the application of external field stimulation, which appeared to protect parts of the endocardium in the complex model from strong polarizations, whereas intramural virtual electrodes caused by blood vessels and extracellular cleft spaces appeared to reduce polarization of the epicardium. Postshock, these differences resulted in the genesis of new excitation wavefronts that were not observed in more simplified models. Furthermore, global differences in the stimulus recovery rates of apex/base regions were observed, causing differences in the ensuing arrhythmogenic episodes. In conclusion, structurally simplified models are well suited for a large range of cardiac modeling applications. However, important differences are seen when behavior at microscales is relevant, particularly when examining the effects of external electrical stimulation on tissue electrophysiology and arrhythmia induction. This highlights the utility of histoanatomically detailed models for investigations of cardiac function, in particular for future patient-specific modeling.


Figures

Fig. 1.
Fig. 1.
Three-dimensional (3-D) magnetic resonance (MR) dataset, visualizing the data in the transverse (A), frontal (B), and sagittal (C) planes through the voxel stack. For clarity, the region of interest containing only the heart is shown (902 × 832 × 1,368 voxels). D: enlarged regions of the transmural plane image corresponding to the dashed square in A comparing the full-resolution MR image (left) with the downsampled image (right).
Fig. 2.
Fig. 2.
Results of the automated sequential segmentation pipeline shown in the transverse (top) and frontal (bottom) slices. A: unsegmented MR dataset. B: output from the first stage in the segmentation pipeline, the threshold level-set filter, which acts as a good approximate initial segmentation. C: output from the geodesic active contour filter. D: final result of the segmentation pipeline following the Laplacian level-set filter.
Fig. 3.
Fig. 3.
Removal of the atrial tissue from the segmented voxel stack. A: frontal slice through the MR dataset showing an example of the manually placed points along the line believed to separate the atria and ventricles (pink dots). B: 3-D representation of the binary mask generated by the two-dimensional surface separating the ventricles and atria. C: frontal slice through the final segmented image stack with the atria removed.
Fig. 4.
Fig. 4.
Tetrahedral finite-element rabbit ventricular mesh. A: visualization of the final ventricular finite-element mesh from a standard anterior view (left) along with cuts along the frontal (middle) and transveral (right) planes to expose endocardial structures. B: highlighted region from an exposed clipping plane in a posterior view demonstrating the level of detail in the finite-element mesh on the endocardial surfaces. C: cut along a frontal clipping plane in a posterior view showing the tagged structures of the papillary muscles (green) and valves or cordae tendinae (blue). Note that the valves do not retain their in vivo shape due to the preparation of the heart. D: simplified rabbit ventricular finite-element model shown from a standard anterior view (left) along with cuts along frontal (middle) and transverse (right) clipping planes. The helix angle α and vectors z, u, v, and af (defining the global apex-base, transmural, circumferential, and fiber directions, respectively) were used in the calculation of fiber orientation explained in Incorporation of Fiber Orientation Information.
Fig. 5.
Fig. 5.
A: vector representation of fiber directions (defined via the algorithm described in Rule-based algorithm for incorporating fiber architecture) within a section of the left ventricular (LV) wall, right ventricular (RV) wall, and septum. The color bar represents the out-of-plane rotation of the fiber vectors. B: Visualization of fiber vectors within the papillary muscle following assignment via the method described in Anatomically based model of fiber architecture within the papillary muscles. Fiber vectors are shown here as white arrows for clarity. Visualization was with Meshalzyer software.
Fig. 6.
Fig. 6.
Propagation of activation wavefronts after an apical stimulus. Shown are snapshots of membrane potential (Vm) distributions within the anatomically complex model (top half) and simplified model (bottom half) at different instances in time after stimulation close to the apex. Each image shows the Vm distribution in an epicardial view (top row) and where clipping planes have been used in transverse (middle row) and frontal (bottom row) plane cuts.
Fig. 7.
Fig. 7.
Distribution of electrical polarization after an external stimulus. Shown are snapshots of Vm distributions within the anatomically complex model (top half) and simplified model (bottom half) at different instances in time after the application of an external electrical stimulus with a coupling interval (CI) = 195 ms and SS = 2 V/cm. Each image shows the Vm distribution in a posterior view where clipping planes have been used in transverse (top row) and frontal (bottom row) plane cuts. Note that white represents polarization levels >40 mV.
Fig. 8.
Fig. 8.
Progression of electrical activation dynamics during stimulus-induced arrhythmogenesis. Shown is the Vm distribution on the posterior epicardial surface of the ventricles of the anatomically complex model (top half) and simplified model (bottom half) at different time instances after arrhythmia induction for the externally applied stimulus shown in Fig. 7 (CI = 195 ms, SS = 2 V/cm).
Fig. 9.
Fig. 9.
Identification of discrete surfaces. A: whole cardiac mesh [including atrial tissue] produced from Tetgen showing the tagged tetrahedral elements: myocardium (green), LV/right atrial (RA) cavities (red), and RV/RA cavities (blue). B: schematic diagram showing the identification of different surfaces based on the tags of bordering elements. The example shown is of an LV endocardial face triangle. C: visualization of the tagged surface nodes in the final ventricular finite-element mesh, representing the epicardium (red), LV endocardium (white), and RV endocardium (yellow).

Similar articles

Cited by

References

    1. Ashihara T, Trayanova NA. Asymmetry in membrane responses to electric shocks: insights from bidomain simulations. Biophys J 87: 2271–22782, 2004 - PMC - PubMed
    1. Ashihara T, Constantino J, Trayanova NA. Tunnel propagation of postshock activations as a hypothesis for fibrillation induction and isoelectric window. Circ Res 102: 737–745, 2008 - PMC - PubMed
    1. Aslanidi OV, Mornev OA, Holden AV. Low-voltage defibrillation in bidomain virtual ventricular tissue: effect of the bath. Comput Cardiol 29: 255–258, 2002
    1. Bishop M, Rodriguez B, Qu F, Efimov I, Gavaghan D, Trayanova N. The role of photon scattering in optical signal distortion during arrhythmia and defibrillation. Biophys J 93: 3714–3726, 2007 - PMC - PubMed
    1. Bishop M, Hales P, Plank G, Gavaghan D, Schneider J, Grau V. Comparison of rule-based and dtmri-derived fiber architecture in a whole rat ventricular computational model. Lecture Notes Comput Sci 5528: 87–96, 2009

Publication types

LinkOut - more resources