Review
. 2010 Jan;38(1):110-22.
doi: 10.1177/0192623309354108. Epub 2009 Nov 21.

Estrogen and xenoestrogens in breast cancer

Affiliations
Review

Estrogen and xenoestrogens in breast cancer

S V Fernandez et al. Toxicol Pathol. 2010 Jan.

Abstract

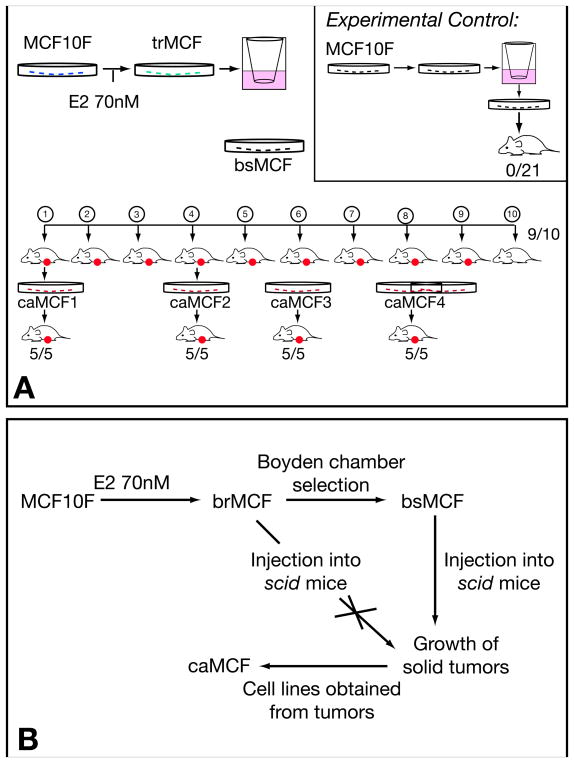
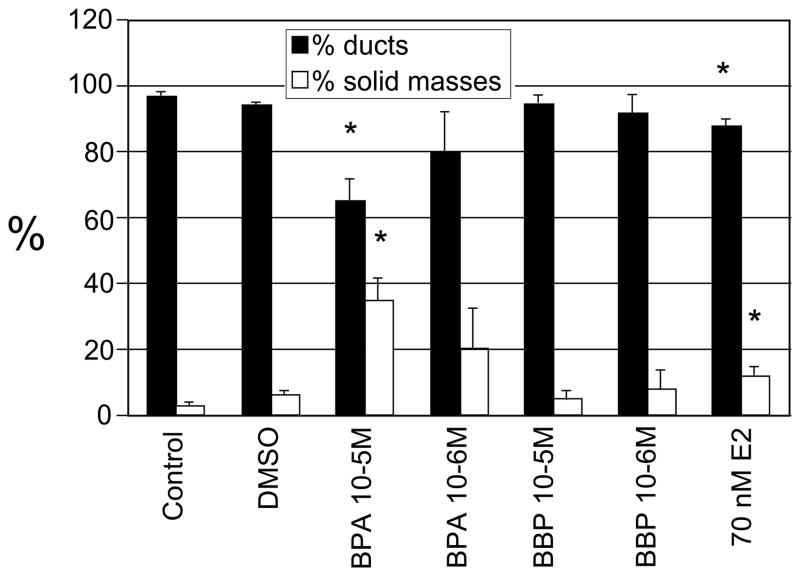
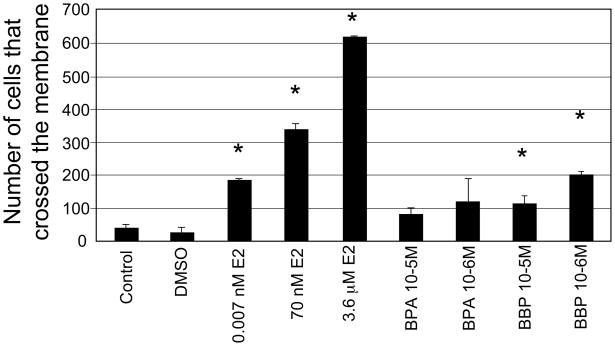
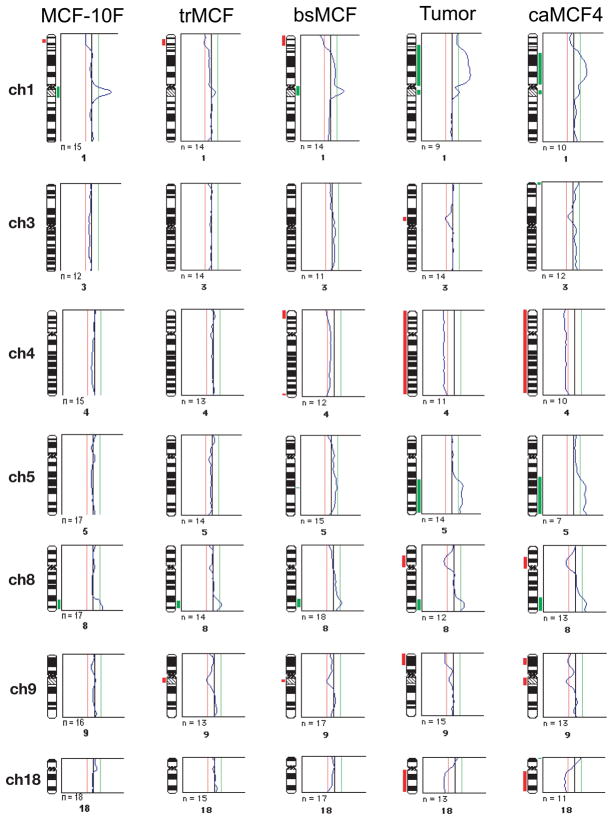
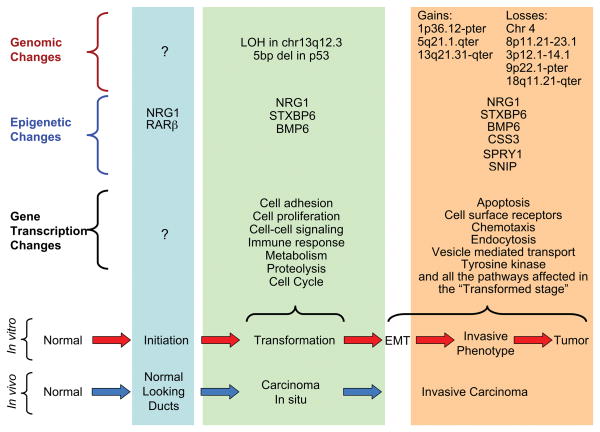
There is growing concern that estrogenic environmental compounds that act as endocrine-disrupting chemicals might potentially have adverse effects on hormone-sensitive organs such as the breast. This concern is further fueled by evidence indicating that natural estrogens, specifically 17beta-estradiol, are important factors in the initiation and progression of breast cancer. We have developed an in vitro-in vivo model in which we have demonstrated the carcinogenicity of E2 in human breast epithelial cells MCF-10F. Hypermethylation of NRG1, STXBP6, BMP6, CSS3, SPRY1, and SNIP were found at different progression stages in this model. The use of this powerful and unique model has provided a tool for exploring whether bisphenol A and butyl benzyl phthalate have relevance in the initiation of breast cancer. These studies provide firsthand evidence that the natural estrogen 17beta-estradiol and xenoestrogenic substances like bisphenol A are able to induce neoplastic transformation in human breast epithelial cells.


Figures

Figure 1
Figure 1. In vitro-in vivo model of estrogen induced transformation of the human breast epithelial cell MCF-10F
A) Esquematic representation of the experiments performed in SCID mice. MCF-10F was treated with 70nM E2 giving origin to trMCF cells; the trMCF cells were placed on matrigel Boyden chambers and the cells that pass through the membrane were collected, expanded and injected into the fat mammary pad of SCID mice; these cells were designated bsMCF. The bsMCF cells produced tumors in nine out of ten mice. Cells were isolated from the tumors originating caMCF1, caMCF2, caMCF3 and caMCF4, and all of these cells produced tumors when they were injected in the mammary gland of SCID mice. Experimental control: MCF-10F cells were placed in Boyden chambers and the cells that passed through the membranes were collected, expanded and injected into SCID mice; none of these cells produced tumors. (Modified from: Russo et al.: FASEB J 20:1622–1634, 2006). B) Different stages in the in vitro-in vivo model of cell transformation: MCF-10F (normal stage), trMCF (cells transformed by estradiol), bsMCF (invasive stage) and caMCF (tumorigenic stage). The trMCF cells did not form tumors in SCID mice although the invasive bsMCF cells formed tumors that gave origin to caMCF cell lines. (Modified from: Huang et al.: Cancer Res 67 11147–11157, 2007).
Figure 2
Figure 2. Percentage of ducts and solid masses in collagen matrix after BPA, BBP and E2 treatments
MCF-10F cells were treated with 10−5M and 10−6M BPA or BPA continuously for fifteen days. As controls the cells were treated with DMSO (vehicle) or grown in regular media. Also, MCF-10F cells were treated with 70nM E2 for 24 hours, twice a week, for two weeks. Student t-test was used for comparison between treatments and control and a p≤0.01 was accepted as statistically significant. The number of tubules and solid masses grown in four wells were counted. The mean (±SD) and the statistically significant differences from the control (*) are indicated.
Figure 3
Figure 3. Ducts and solid masses formed by MCF-10F cells treated with BPA or BBP
MCF-10F treated with A) DMSO; B) BPA 10−5M; C) BPA 10−6M; D) BBP10−5M; E) BBP 10−6M. The bars at the bottom right corners of each picture represent 100 μm.
Figure 4
Figure 4. Invasion assay
The cells that migrated through the membrane were counted after the different treatments: MCF-10F cells treated with 10−5M BPA; 10−6M BPA; 10−5M BBP, 10−6M BBP and, MCF-10F treated with E2 (0.007nM, 70nM or 3.6 μM). As controls, cells were grown in regular media or media with DMSO. Student t-test was used for comparison between treatments and control and a p≤0.01 was accepted as statistically significant. Three replicates were made for each treatment. The mean (±SD) and the statistically significant differences from the control (*) are indicated.
Figure 5
Figure 5. Comparative genomic hybridization (CGH) analysis of the in vitro-in vivo model of cell transformation induced by E2
The threshold was set at 0.8 and 1.2 for losses and gains respectively; the mean values of individual ratio profiles were calculated from at least 7 metaphase spreads and averaged values were plotted as profiles alongside individual chromosome ideograms. The chromosomal imbalances are shown in a histogram which represents the DNA gains (in green) and losses (in red) as an incidence curve along each chromosome. Only chromosomes with changes are represented. Also, the gains and losses found in the tumor (Tumor) that gave origin to caMCF4 are represented.
Figure 6
Figure 6. Restriction Landmark Genomic Scanning (RLGS)
A) The DNA is cut with the methylation-sensitive NotI. The recognition sequence for NotI, GC’GGCCGC, has two CpG sites and NotI will not cut if the site is methylated. The overhangs of cut sites are filled with radiolabeled dCTP and dGTP. Afterwards, the fragments were digested with EcoRV to get fragments into a resolvable size and, the labeled fragments were separated in first dimension 0.8% agarose tube gel. The gel was treated with HinfI to cut the DNA into smaller fragments and the tube gel was placed perpendicularly on a top of 5% polyacrylamide gel and separated in second dimension. B) Autoradiogram of the RLGS polyacrylamide gel. Sites of differential methylation are identified by comparison with a control profile; when comparing control and treated, hypomethylation would appear as greatly increased intensity of RLGS spots; RLGS spot loss is due to hypermethylation of the NotI site. Each virtual spot is pre-defined by a specific sequence in a database.
Figure 7
Figure 7. DNMT1, DNMT3A and DNMT3B expressions in the in vitro- in vivo model of cell transformation
The expression of the different DNA methyltransferases was studied by real time RT-PCR in trMCF, bsMCF and caMCF cells and compared to the expression in MCF-10F. The real time RT-PCR was done in triplicate for each sample/primer/probe. Student t-test was used for comparison between treatments and control and a p≤0.01 was accepted as statistically significant. The mean (±SD) and the statistically significant differences from the control MCF-10F (*) are indicated.
Figure 8
Figure 8. Molecular pathway of neoplastic transformation of breast epithelial cells
In the lower portion of the figure, the phenotypes of breast cancer progression in vivo are compared with those in the in vitro model. The genomic, epigenetic and gene transcription changes are listed and compared among the different stages of cancer progression. In the epigenetic changes, the hypermethylated genes at the different stages are indicated. In the transformation stage, loss of heterozygosity (LOH) in chromosome 13q12.3 and a 5 base-pair deletion in p53 exon 4 were detected. In the invasive and tumor stages, several gains and losses have been described. EMT: epithelial-mesenchymal transition.

Similar articles

Cited by

References

    1. Breast cancer and hormone replacement therapy: collaborative reanalysis of data from 51 epidemiological studies of 52,705 women with breast cancer and 108,411 women without breast cancer. Collaborative Group on Hormonal Factors in Breast Cancer. Lancet. 350(9084):1047–59. - PubMed
    1. Akingbemi BT, Sottas CM, Koulova AI, Klinefelter GR, Hardy MP. Inhibition of testicular steroidogenesis by the xenoestrogen bisphenol A is associated with reduced pituitary luteinizing hormone secretion and decreased steroidogenic enzyme gene expression in rat Leydig cells. Endocrinology. 2004;145(2):592–603. - PubMed
    1. Andersen HR, Andersson AM, Arnold SF, Autrup H, Barfoed M, Beresford NA, et al. Comparison of short-term estrogenicity tests for identification of hormone-disrupting chemicals. Environ Health Perspect. 1999;107(Suppl 1):89–108. - PMC - PubMed
    1. Bakken K, Alsaker E, Eggen AE, Lund E. Hormone replacement therapy and incidence of hormone-dependent cancers in the Norwegian Women and Cancer study. Int J Cancer. 2004;112(1):130–4. - PubMed
    1. Belinsky SA, Nikula KJ, Baylin SB, Issa JP. Increased cytosine DNA-methyltransferase activity is target-cell-specific and an early event in lung cancer. Proc Natl Acad Sci U S A. 1996;93(9):4045–50. - PMC - PubMed

Publication types