

Ploidy and the evolution of endosperm of flowering plants
- PMID: 19933875
- PMCID: PMC2828724
- DOI: 10.1534/genetics.109.110833
Ploidy and the evolution of endosperm of flowering plants
Abstract
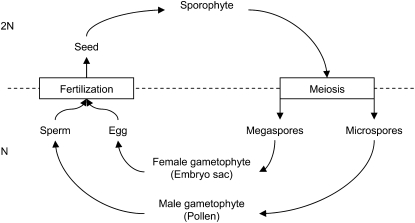
In angiosperms, spermatozoa go by pair in each pollen grain and fertilize, in addition to the egg cell, one of its sister cells, called the central cell. This "double fertilization" leads to the embryo on the one hand and to its nutritive tissue, the endosperm, on the other hand. In addition, in most flowering plants, the endosperm is triploid because of a doubled maternal genetic contribution in the central cell. Most of the hypotheses trying to explain these eccentricities rest on the assumption of a male/female conflict over seed resource allocation. We investigate an alternative hypothesis on the basis of the masking of deleterious alleles. Using analytical methods, we show that a doubled maternal contribution and double fertilization tend to be favored in a wide range of conditions when deleterious mutations alter the function of the endosperm. Furthermore, we show that these conditions vary depending on whether these traits are under male or female control, which allows us to describe a new type of male/female conflict.
Figures


Similar articles
-
Selective egg cell polyspermy bypasses the triploid block.Elife. 2020 Feb 6;9:e52976. doi: 10.7554/eLife.52976. Elife. 2020. PMID: 32027307 Free PMC article.
-
Maternal regulation of seed growth and patterning in flowering plants.Curr Top Dev Biol. 2020;140:257-282. doi: 10.1016/bs.ctdb.2019.10.008. Epub 2019 Nov 19. Curr Top Dev Biol. 2020. PMID: 32591076
-
Double fertilization in Arabidopsis thaliana involves a polyspermy block on the egg but not the central cell.Mol Plant. 2008 Jul;1(4):611-9. doi: 10.1093/mp/ssn016. Epub 2008 May 21. Mol Plant. 2008. PMID: 19825566
-
Developmental and evolutionary hypotheses for the origin of double fertilization and endosperm.C R Acad Sci III. 2001 Jun;324(6):559-67. doi: 10.1016/s0764-4469(01)01326-9. C R Acad Sci III. 2001. PMID: 11455879 Review.
-
Meiosis in flowering plants and other green organisms.J Exp Bot. 2010 Jun;61(11):2863-75. doi: 10.1093/jxb/erq191. J Exp Bot. 2010. PMID: 20576791 Review.
Cited by
-
Fitness landscapes: an alternative theory for the dominance of mutation.Genetics. 2011 Nov;189(3):923-37. doi: 10.1534/genetics.111.132944. Epub 2011 Sep 2. Genetics. 2011. PMID: 21890744 Free PMC article.
-
Enhancer Runaway and the Evolution of Diploid Gene Expression.PLoS Genet. 2015 Nov 12;11(11):e1005665. doi: 10.1371/journal.pgen.1005665. eCollection 2015 Nov. PLoS Genet. 2015. PMID: 26561855 Free PMC article.
-
Kin recognition within a seed and the effect of genetic relatedness of an endosperm to its compatriot embryo on maize seed development.Proc Natl Acad Sci U S A. 2013 Feb 5;110(6):2217-22. doi: 10.1073/pnas.1220885110. Epub 2013 Jan 23. Proc Natl Acad Sci U S A. 2013. PMID: 23345441 Free PMC article.
-
The role of developmental plasticity in evolutionary innovation.Proc Biol Sci. 2011 Sep 22;278(1719):2705-13. doi: 10.1098/rspb.2011.0971. Epub 2011 Jun 15. Proc Biol Sci. 2011. PMID: 21676977 Free PMC article. Review.
-
Sex-Linked Molecular Markers Identify Female Lines in Endosperm-Derived Kiwifruit Callus and in Regenerants.Plants (Basel). 2021 Mar 11;10(3):526. doi: 10.3390/plants10030526. Plants (Basel). 2021. PMID: 33799868 Free PMC article.
References
-
- Brink, R. A., and D. C. Cooper, 1940. Double fertilization and development of the seed in angiosperms. Bot. Gaz. 102 1–25.
-
- Brown, C. A., and D. R. Formanowicz, 1996. Reproductive investment in two species of scorpion, Vaejovis waueri (Vaejovidae) and Diplocentrus linda (Diplocentridae), from West Texas. Ann. Entomol. Soc. Am. 89 41–46.
Publication types
MeSH terms
LinkOut - more resources
Full Text Sources
