. 2010 Feb;59(2):386-96.
doi: 10.2337/db09-0925. Epub 2009 Nov 23.

Differential effect of saturated and unsaturated free fatty acids on the generation of monocyte adhesion and chemotactic factors by adipocytes: dissociation of adipocyte hypertrophy from inflammation

Affiliations

Differential effect of saturated and unsaturated free fatty acids on the generation of monocyte adhesion and chemotactic factors by adipocytes: dissociation of adipocyte hypertrophy from inflammation

Chang Yeop Han et al. Diabetes. 2010 Feb.

Abstract

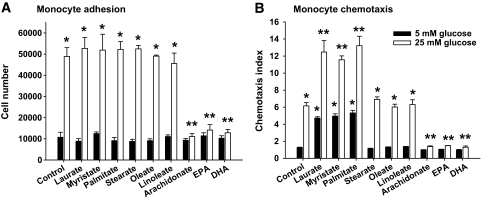
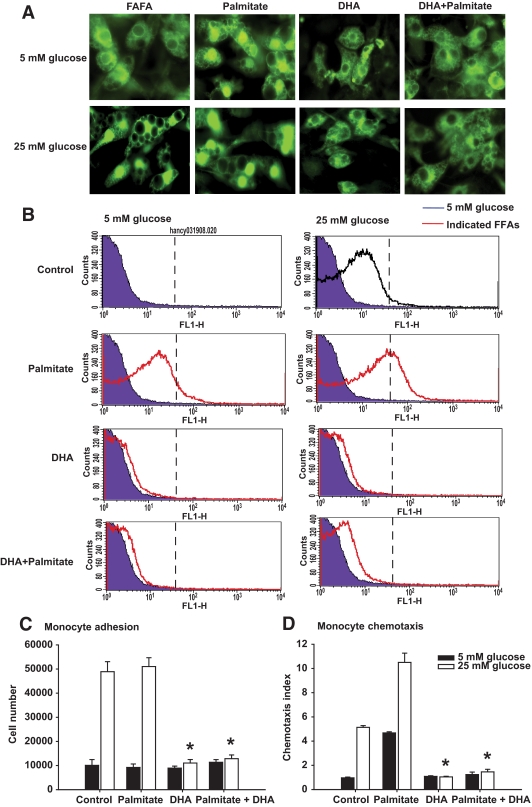
Objective: Obesity is associated with monocyte-macrophage accumulation in adipose tissue. Previously, we showed that glucose-stimulated production by adipocytes of serum amyloid A (SAA), monocyte chemoattractant protein (MCP)-1, and hyaluronan (HA) facilitated monocyte accumulation. The current objective was to determine how the other major nutrient, free fatty acids (FFAs), affects these molecules and monocyte recruitment by adipocytes.

Research design and methods: Differentiated 3T3-L1, Simpson-Golabi-Behmel syndrome adipocytes, and mouse embryonic fibroblasts were exposed to various FFAs (250 micromol/l) in either 5 or 25 mmol/l (high) glucose for evaluation of SAA, MCP-1, and HA regulation in vitro.

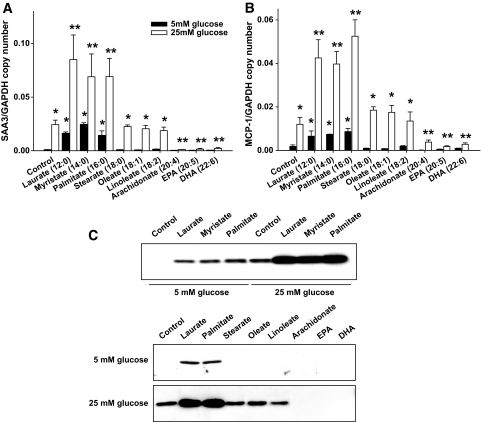
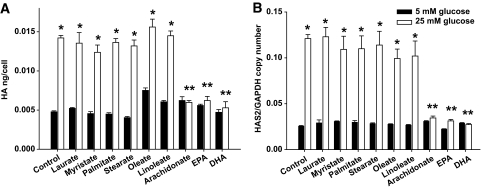
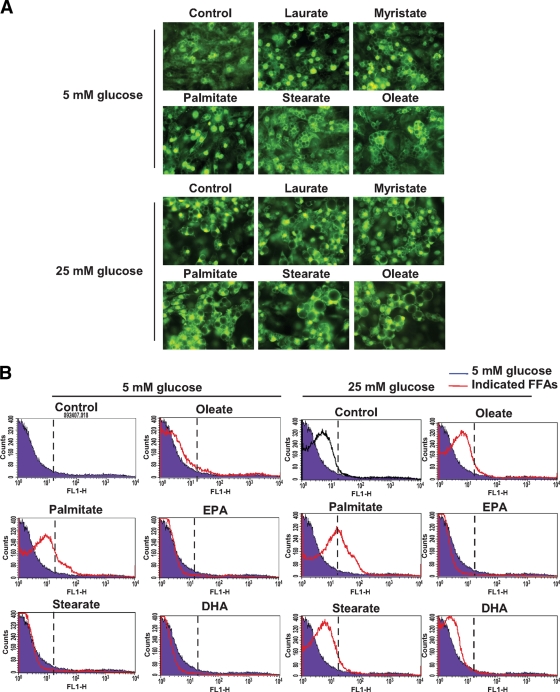
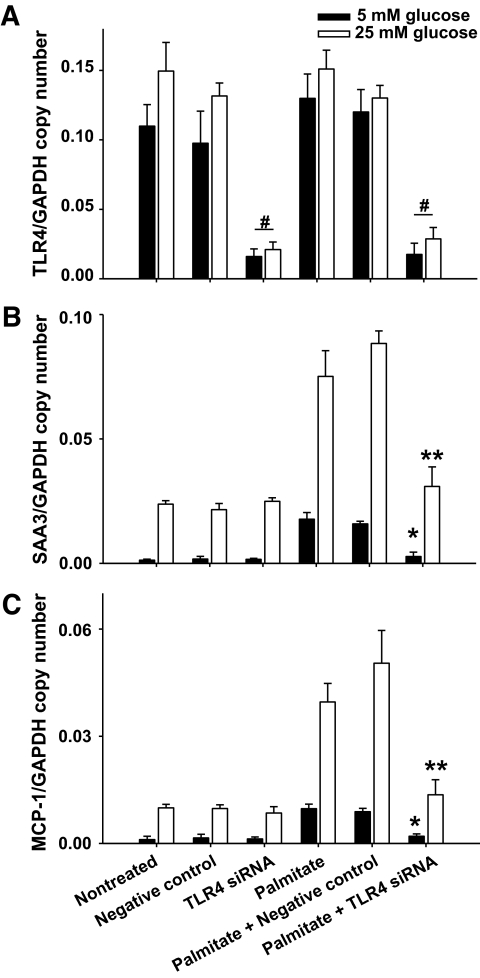
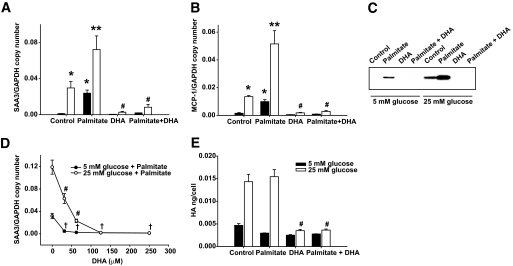
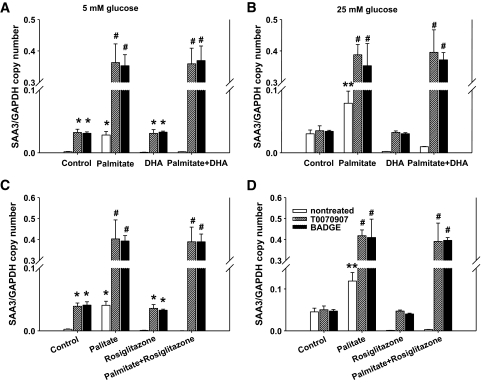
Results: Saturated fatty acids (SFAs) such as laurate, myristate, and palmitate increased cellular triglyceride accumulation, SAA, and MCP-1 expression; generated reactive oxygen species (ROS); and increased nuclear factor (NF) kappaB translocation in both 5 and 25 mmol/l glucose. Conversely, polyunsaturated fatty acids (PUFAs) such as arachidonate, eicosapentaenate, and docosahexaenate (DHA) decreased these events. Gene expression could be dissociated from triglyceride accumulation. Although excess glucose increased HA content, SFAs, oleate, and linoleate did not. Antioxidant treatment repressed glucose- and palmitate-stimulated ROS generation and NFkappaB translocation and decreased SAA and MCP-1 expression and monocyte chemotaxis. Silencing toll-like receptor-4 (TLR4) markedly reduced SAA and MCP-1 expression in response to palmitate but not glucose. DHA suppressed NFkappaB translocation stimulated by both excess glucose and palmitate via a peroxisome prolifterator-activated receptor (PPAR) gamma-dependent pathway.

Conclusions: Excess glucose and SFAs regulate chemotactic factor expression by a mechanism that involves ROS generation, NFkappaB, and PPARgamma, and which is repressed by PUFAs. Certain SFAs, but not excess glucose, trigger chemotactic factor expression via a TLR4-dependent pathway.


Figures

FIG. 1.
FIG. 1.
SAA3 and MCP-1 expression is stimulated by specific SFAs and inhibited by specific PUFAs. 3T3–L1 adipocytes were differentiated in 5 or 25 mmol/l glucose and cultured for 7 days in the same medium with various FFAs (250 μmol/l). Total RNA was isolated and analyzed by multiplex real-time RT-PCR using SAA3-specific (A) or MCP-1–specific (B) primers and probes and normalized to GAPDH. C: Conditioned media were analyzed by immunoblot using anti-SAA3 antibody. *P < 0.001 vs. 5 mmol/l glucose control. **P < 0.001 vs. 25 mmol/l glucose control.
FIG. 2.
FIG. 2.
HA content and HAS2 gene expression are increased by high glucose conditions but not SFAs and attenuated by arachidonate, EPA, and DHA. 3T3–L1 adipocytes differentiated in 5 or 25 mmol/l glucose were cultured for 7 days in the same media with or without various FFAs (250 μmol/l). A: Cell lysates that included cell-associated extracellular matrix were harvested and analyzed for HA content by ELISA. B: Total RNA was isolated and analyzed by multiplex real-time RT-PCR using HAS2 specific primers and probes and normalized to GAPDH. *P < 0.001 vs. 5 mmol/l glucose control. **P < 0.001 vs. 25 mmol/l glucose control.
FIG. 3.
FIG. 3.
Monocyte adhesion and chemotaxis are increased by growth of adipocytes in the presence of excess glucose and certain SFAs. 3T3–L1 preadipocytes were differentiated into adipocytes and cultured for 7 days in 5 or 25 mmol/l glucose-containing media with various FFAs (250 μmol/l) with daily medium changes. U937 monocytes, prelabeled with calcein-AM, were then added and allowed to adhere for 90 min at 4°C. The cells were then washed three times and adherent cells measured in a multiwell fluorescent plate reader. A: Results are expressed as the number of adherent U937 cells per dish. In separate experiments, THP-1 monocytes, prelabeled with calcein-AM, were placed into the top chambers of a 96-well Boyden chemotaxis and conditioned media from adipocytes were placed in the bottom chambers. B: After incubation for 90 min, migrated monocytes were counted with a multiwell fluorescent plate reader. *P < 0.001 vs. 5 mmol/l glucose control. **P < 0.001 vs. 25 mmol/l glucose control.
FIG. 4.
FIG. 4.
FFAs have differential effects on NFκB translocation and ROS generation. 3T3–L1 adipocytes differentiated in 5 or 25 mmol/l glucose were cultured on glass for 7 days in the same medium with various FFAs (250 μmol/l) as indicated. A: Adipocytes were fixed and stained using an anti-p65 NFκB antibody, followed by the addition of a fluorescein isothiocyanate secondary antibody (original magnification ×400). B: Cells were subjected to FACS analysis using CM-H2DCFDA. Results are plotted as counts (number of cells) on the vertical axis versus CM-DCF fluorescence intensity on the horizontal axis. Cells exposed to 5 mmol/l glucose are shown in the blue color and are used as the negative control. The dashed lines, which indicate the peak of CM-DCF fluorescence of cells exposed to 250 μmol/l palmitate in the presence of 25 mmol/l glucose, are used as the high reference. These two conditions are used as low and high standards to compare ROS generation by the different FFAs, which are shown in red. Cells exposed to 25 mmol/l glucose alone are shown in black. (A high-quality digital representation of this figure is available in the online issue.)
FIG. 5.
FIG. 5.
Inhibition of palmitate-induced expression of SAA3 and MCP-1 by silencing TLR4. 3T3–L1 adipocytes were transfected with a siRNA specific for TLR4 or a scrambled siRNA (negative control). Twenty-four hours later, the cells were exposed to palmitate (250 μmol/l) in 5 and 25 mmol/l glucose for 7 days with daily medium changes. Total RNA was isolated and analyzed by multiplex real-time RT-PCR using primers specific for TLR4 (A), SAA3 (B), or MCP-1 (C) and normalized to GAPDH. *P < 0.001 vs. negative control plus palmitate in 5 mmol/l glucose. **P < 0.001 vs. negative control plus palmitate in 25 mmol/l glucose. #P < 0.001 vs. negative control.
FIG. 6.
FIG. 6.
DHA suppresses SAA3, MCP-1 gene expression, and HA content. 3T3–L1 adipocytes differentiated in 5 and 25 mmol/l glucose were cultured for 7 days with and without palmitate (250 μmol/l) and/or DHA (250 μmol/l). Total RNA was collected for analysis of SAA3 and MCP-1 mRNA expression by real-time RT-PCR using SAA3- and MCP-1–specific primers and probes and normalized to GAPDH (A and B), and conditioned media were analyzed by immunoblot using a SAA3 antibody (C). E: Cell lysates were also harvested for analysis of HA content by ELISA. D: To determine the concentration dependence of DHA, differentiated 3T3–L1 adipocytes were cultured in 5 and 25 mmol/l glucose with and without palmitate (250 μmol/l) plus the concentrations of DHA indicated. *P < 0.001 vs. 5 mmol/l glucose control. **P < 0.001 vs. 25 mmol/l glucose control. #P < 0.001 vs. 25 mmol/l glucose with palmitate. †P < 0.01 vs. 5 mmol/l glucose with palmitate.
FIG. 7.
FIG. 7.
DHA suppresses the translocation of NFκB and ROS generation stimulated by excess glucose and palmitate. 3T3–L1 adipocytes were cultured in 5 or 25 mmol/l glucose with or without palmitate or DHA (250 μmol/l) for 7 days as indicated. Nuclear translocation of NFκB was analyzed using an anti-p65 NFκB antibody followed by a fluorescein isothiocyanate–labeled secondary antibody (A, original magnification ×600). B: Cells were also subjected to FACS analysis using CM-H2DCFDA. Results are plotted as counts (number of cells) on the vertical axis versus CM-DCF fluorescence intensity on the horizontal axis. Cells exposed to 5 mmol/l glucose are shown in blue and cells exposed to 250 μmol/l palmitate in the presence of 25 mmol/l glucose as dashed lines. These two conditions are used as low and high standards, respectively, to compare ROS generation by the different FFAs, which are shown in red. Cells exposed to 25 mmol/l glucose alone are shown in black. Cells and conditioned media were subjected to the monocyte adhesion (C) or chemotaxis (D) assays described in the legend to Fig. 3. *P < 0.001 vs. 25 mmol/l glucose with palmitate. (A high-quality digital representation of this figure is available in the online issue.)
FIG. 8.
FIG. 8.
The PPARγ antagonists, T0070907 and BADGE, abolish the anti-inflammatory effect of DHA. 3T3–L1 adipocytes differentiated in 5 mmol/l (A and C) or 25 mmol/l (B and D) glucose were cultured in the same media with or without 250 μmol/l of palmitate and/or DHA (250 μmol/l) for 7 days. Some adipocytes were also replenished with the PPARγ antagonists, T0070907 (1 μmol/l) or BADGE (100 μmol/l). As controls for DHA, rosiglitazone (100 nmol/l) was used instead of DHA (C and D). Total RNA was isolated and analyzed by multiplex real-time RT-PCR using SAA3-specific (A, C, and D) or MCP-1–specific (B) primers and probes and normalized to GAPDH. *P < 0.001 vs. 5 mmol/l glucose control. **P < 0.001 vs. 25 mmol/l glucose control. #P < 0.001 vs. 25 mmol/l glucose with palmitate.

References

    1. Wellen KE, Hotamisligil GS: Obesity-induced inflammatory changes in adipose tissue. J Clin Invest 2003;112:1785–1788 - PMC - PubMed
    1. Xu H, Barnes GT, Yang Q, Tan G, Yang D, Chou CJ, Sole J, Nichols A, Ross JS, Tartaglia LA, Chen H: Chronic inflammation in fat plays a crucial role in the development of obesity-related insulin resistance. J Clin Invest 2003;112:1821–1830 - PMC - PubMed
    1. Weisberg SP, McCann D, Desai M, Rosenbaum M, Leibel RL, Ferrante AW, Jr: Obesity is associated with macrophage accumulation in adipose tissue. J Clin Invest 2003;112:1796–1808 - PMC - PubMed
    1. Bullo M, Garcia-Lorda P, Megias I, Salas-Salvado J: Systemic inflammation, adipose tissue tumor necrosis factor, and leptin expression. Obes Res 2003;11:525–531 - PubMed
    1. Maachi M, Pieroni L, Bruckert E, Jardel C, Fellahi S, Hainque B, Capeau J, Bastard JP: Systemic low-grade inflammation is related to both circulating and adipose tissue TNFalpha, leptin and IL-6 levels in obese women. Int J Obes Relat Metab Disord 2004;28:993–997 - PubMed

Publication types

MeSH terms