. 2009 Dec;136(24):4187-97.
doi: 10.1242/dev.042770.

Control in time and space: Tramtrack69 cooperates with Notch and Ecdysone to repress ectopic fate and shape changes during Drosophila egg chamber maturation

Affiliations

Control in time and space: Tramtrack69 cooperates with Notch and Ecdysone to repress ectopic fate and shape changes during Drosophila egg chamber maturation

Michael J Boyle et al. Development. 2009 Dec.

Abstract

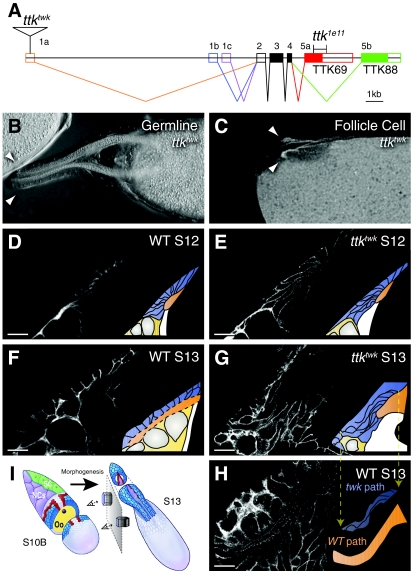
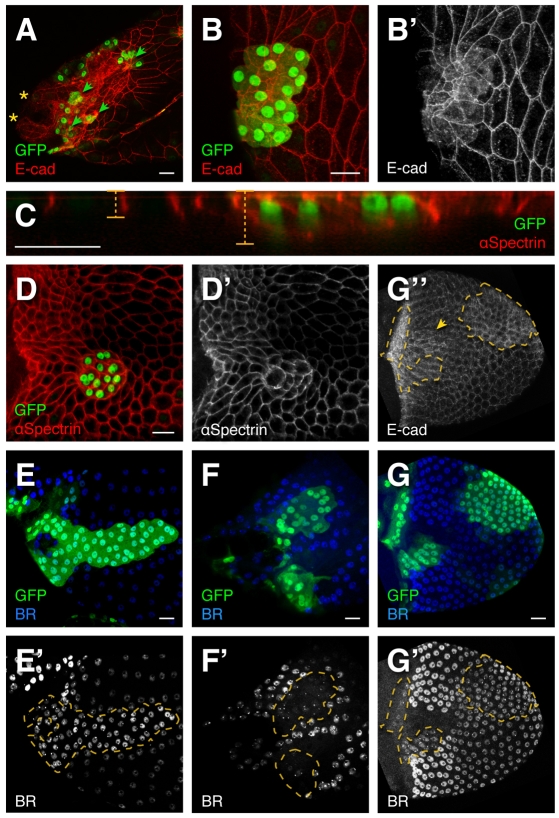
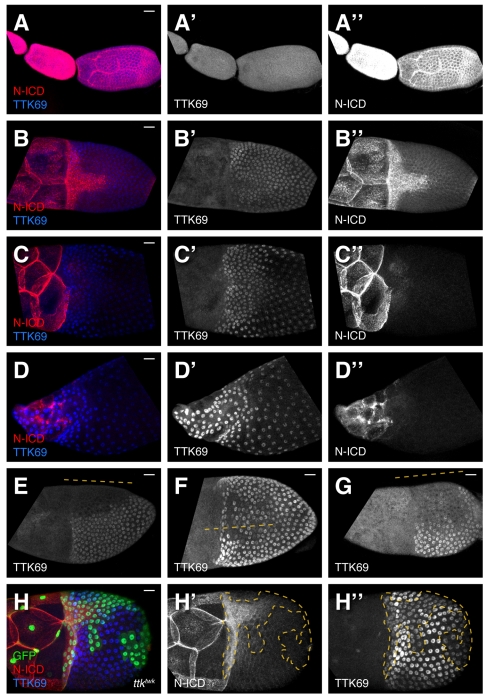
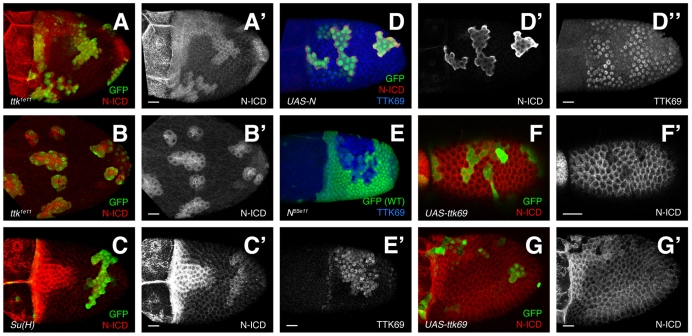
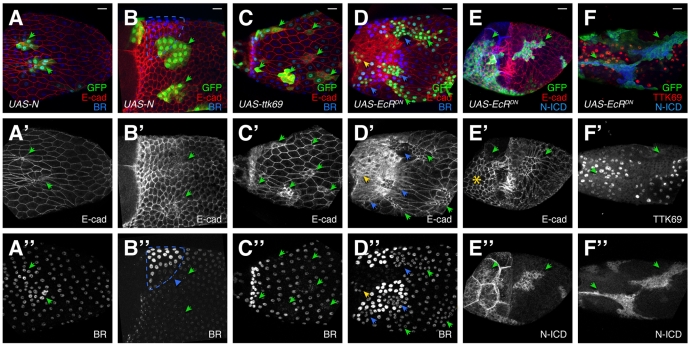
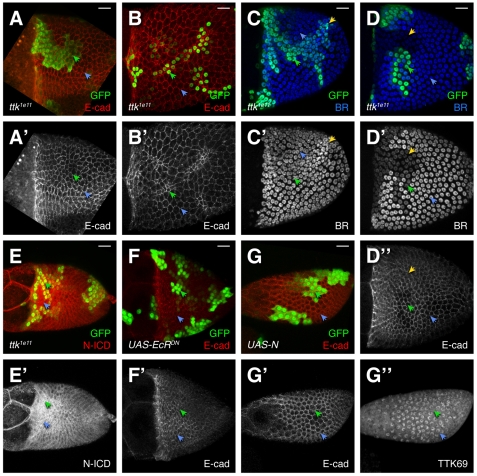
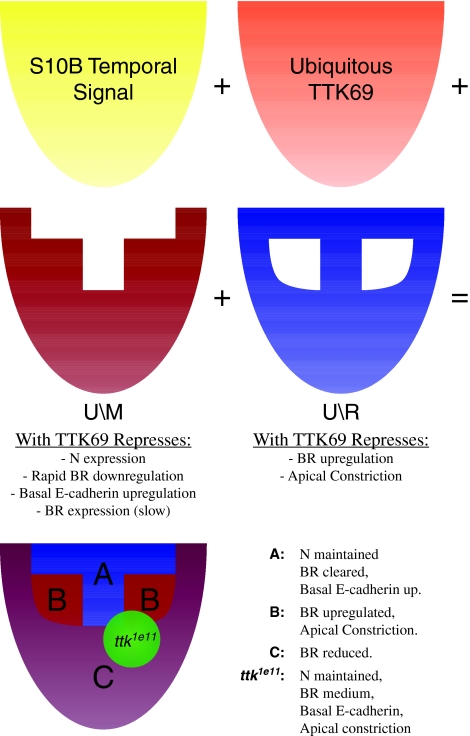
Organ morphogenesis requires cooperation between cells, which determine their course of action based upon location within a tissue. Just as important, cells must synchronize their activities, which requires awareness of developmental time. To understand how cells coordinate behaviors in time and space, we analyzed Drosophila egg chamber development. We found that the transcription factor Tramtrack69 (TTK69) controls the fates and shapes of all columnar follicle cells by integrating temporal and spatial information, restricting characteristic changes in morphology and expression that occur at stage 10B to appropriate domains. TTK69 is required again later in oogenesis: it controls the volume of the dorsal-appendage (DA) tubes by promoting apical re-expansion and lateral shortening of DA-forming follicle cells. We show that TTK69 and Notch compete to repress each other's expression and that a local Ecdysone signal is required to shift the balance in favor of TTK69. We hypothesize that TTK69 then cooperates with spatially restricted co-factors to define appropriate responses to a globally available (but as yet unidentified) temporal signal that initiates the S10B transformations.


Figures

Fig. 1.
Fig. 1.
tramtrack69 is required in the follicle cells for proper morphogenesis. (A) The ttk locus. The twk P element disrupts 1a-containing transcripts while the 1e11 deletion removes most of the TTK69 zinc finger (red box) but not the BTB domain. (B) Germline ttktwk clone at S14 with normal appendages (arrowheads). (C) S14 whole follicular epithelium clone of ttktwk marked by absence of nuclear GFP. Chorion autofluorescence reveals short appendages (arrowheads). (D-H) DA-forming cell shapes before tube elongation at S12 (D,E) and after at S13 (F,G,H) in wild-type (D,F,H) and ttktwk (E,G) egg chambers. Images are single confocal slices; lateral cell membranes are stained with antibody against alpha-spectrin. D,E,G,H are lateral views. Wild-type DA-forming cells rotate ventrally as they migrate anteriorly. To maintain comparable view of lateral cell surfaces, the image in F is rotated to a ventrolateral perspective. H shows an unrotated (lateral) view of a wild-type S13 DA. Most DA-forming cells lie above the image plane. A higher section would show their basal surfaces, obscuring the lumen. Insets diagram the cell and DA shapes: DA-forming follicle cells (blue), lumen (orange) and nurse cell nuclei (gray). DA cells normally shorten while expanding their apices (F), but fail to do so in ttktwk (G). Nevertheless, ttktwk basal surfaces migrate anteriorly, resulting in thin, elongated cells. (H) Wild-type S13 from a lateral view, showing the bend in the DA. Inset in H compares the shape of elongated ttktwk cells from G (blue, pulled down from the inset in G) to the shape of the wild-type lumen from H (orange). Other features are omitted. The lateral surfaces of ttktwk cells trace the same sigmoidal path as the wild-type DA lumen. (I) Schematic representation of S10B and S13 egg chambers (not to scale) showing the morphogenesis between these stages. Note that the DA-forming cells rotate 90° as they migrate anteriorly. Thus, a lateral section reveals lateral cell surfaces at S10B. At S13, however, lateral cell surfaces are only visible at the base of the appendages. In the anterior a lateral section reveals basal cell surfaces. Adapted with permission (Dorman et al., 2004). Scale bars: 20 μm.
Fig. 2.
Fig. 2.
ttk1e11 disrupts cell shape and patterning. (A) Small clones of ttk1e11 (marked by GFP) result in elevated E-cadherin and extremely constricted apices. ttk1e11 clones (arrowheads) blocked the elongation of the single DA shown in A, causing it to split into two lobes (asterisks). The right appendage, not pictured, lies deep on the far side of the egg chamber. (B,B′) Magnified view of a ttk1e11 clone with severely constricted apices. E-cadherin expression is increased apically and cytoplasmically (B′), resembling expression in the T. Compare cytoplasmic E-cadherin in ttk1e11 clones (B′,G″, outline) to the wild-type T (G″, arrowhead). E-cadherin and GFP expression also reveal basal surfaces that are much larger than apical surfaces. (C) A confocal re-slice through a ttk1e11 clone with alpha-spectrin staining lateral surfaces. ttk1e11 cells are taller than their neighbors. (D,D′) Basal surfaces of ttk1e11 cells are rounded. (E-G″) ttk1e11 affects BR expression. (E) Lateral view at S13. ttk1e11 cells in the main body exhibit elevated BR. Appearance of more tightly packed nuclei within the clone is not due to extra rounds of division but to the smaller size of ttk1e11 cells; this difference is pronounced at this stage because wild-type follicle cells have enlarged to accommodate oocyte growth. (F) Dorsal view at S13. ttk1e11 cells in the roof express reduced BR. (G,G′) Dorsal view at S10B. ttk1e11 cells in the T maintain BR. At this stage, wild-type BR expression in the main body is still as high as BR in ttk1e11 cells but decreases over time (E′). Scale bars: 20 μm.
Fig. 3.
Fig. 3.
Notch intracellular domain and TTK69 expression during late oogenesis. (A-G) Confocal projections of wild-type egg chambers stained for N intracellular domain (N-ICD) and TTK69 collected using uniform exposure conditions. (A) High N and low TTK69 in S6-S9. (B) N clears to the T at early S10B and TTK69 is elevated. (C) No N expression remains in follicle cells at S11 except for a small region in the posterior (not shown). TTK69 levels become higher in the anterior. (D) At S13, N remains off and TTK69 is expressed yet more strongly in the anterior. At all stages, N is expressed in the nurse cells. (E-G) Three examples of early S10B egg chambers showing variable TTK69 expression. Lines indicate approximate dorsal midline position. (H-H″) A ttktwk clone at early S10B (T stage). At this stage, TTK69 is reduced but not eliminated in ttktwk cells. Scale bars: 20 μm.
Fig. 4.
Fig. 4.
TTK69 and N are mutually repressive. (A-B′) Notch intracellular domain (N-ICD) expression is elevated in ttk1e11 clones. (A) Early S10B. N is maintained in the T and ttk1e11 cells. (B) At S13, (after expression in the T has ceased), N expression continues in ttk1e11 clones. (C,C′) At early S10B, Su(H)SF8 clones maintain N, albeit at a level lower than in the T. (D-D″) Overexpression of constitutively active N (red, D′) via FLP-out GAL4 (green) causes reduced TTK69 expression (blue, D″). (E,E′) N55e11 (null) cells upregulate TTK69 (E′) prematurely just before the natural upregulation of TTK69 during S10B. (F-G′) Overexpression of TTK69 reduces N at S9 (F) and in the T (G). Scale bars: 20 μm.
Fig. 5.
Fig. 5.
Expression of activated N, TTK69 and dominant-negative Ecdysone receptor causes defects in follicle cell shape and patterning. FLP-out clones (green/arrowheads) of UAS-N-CA, UAS-ttk69 or UAS-EcR-DN. (A-B″) N-CA cells constrict their apices (A′,B′) and alter BR levels. BR is elevated in the main body late in oogenesis (A″) and reduced in the roof (B″, blue triangle). Expected roof cell region is outlined in blue. (C-C″) UAS-ttk69 causes elevated E-cadherin, reduced cell size (C′), and reduced BR (C″). (D-D″) UAS-EcR-DN results in small cells (D′); BR (D″) is reduced in the roof (blue arrowheads) and maintained in the T (yellow arrowhead). (E-E″) UAS-EcR-DN blocks stretch cell formation (E′, asterisk). (F-F″) UAS-EcR-DN blocks N downregulation (E″,F″) and TTK69 upregulation (F′). Note the nuclear exclusion of TTK69 in the clone (F′). Scale bars: 20 μm.
Fig. 6.
Fig. 6.
The ttk1e11 phenotypes are specific to S10B and later. Compare mutant cells (green arrowheads) with wild-type cells (blue arrowheads). (A-B′) ttk1e11 cells do not constrict their apices at S10A (average apical surface area: 52.2 μm2) (A) but do so at S10B (average apical surface area 34.4 μm2) (B). (C-D″) BR is normal in ttk1e11 cells at S10A (C,C′). The yellow arrowhead indicates a cluster of ttk1e11 mutant cells displaying an endocycle defect (resulting in condensed, brighter nuclei). At the beginning of S10B (D), BR is reduced in ttk1e11 clones, concurrent with the wild-type reduction of BR in the T (D′, yellow arrowhead). Neither roof nor ttk1e11 cells have begun to constrict their apices (D″). (E,E′) At S10A, N is uniformly high and unaffected by ttk1e11. (F,F′) UAS-EcR-DN does not affect cell shape at S10A. (G-G″) At S9, UAS-N-CA expression does not affect cell shape (G′) or TTK69 expression (G″). Scale bars: 20 μm.
Fig. 7.
Fig. 7.
Conceptual model of spatiotemporal regulation by TTK69. One possible mechanism of TTK69 action. Spatially restricted co-factors (red and blue) work with TTK69 (orange) to prevent cells from responding inappropriately to a globally available temporal signal (yellow). The combination of each of these patterns results in the differential reaction of each subpopulation at the onset of S10B. Loss of TTK69 (green) disrupts all regulation.

References

    1. Araújo S. J., Cela C., Llimargas M. (2007). Tramtrack regulates different morphogenetic events during Drosophila tracheal development. Development 134, 3665-3676 - PubMed
    1. Ashe H. L., Briscoe J. (2006). The interpretation of morphogen gradients. Development 133, 385-394 - PubMed
    1. Badenhorst P. (2001). Tramtrack controls glial number and identity in the Drosophila embryonic CNS. Development 128, 4093-4101 - PubMed
    1. Banerjee I., Clayton P. (2007). The genetic basis for the timing of human puberty. J. Neuroendocrinol. 19, 831-838 - PubMed
    1. Baonza A., Murawsky C. M., Travers A. A., Freeman M. (2002). Pointed and Tramtrack69 establish an EGFR-dependent transcriptional switch to regulate mitosis. Nat. Cell Biol. 4, 976-980 - PubMed

Publication types