. 2009 Dec 21;206(13):2987-3000.
doi: 10.1084/jem.20090934. Epub 2009 Nov 23.

GATA-3 is required for early T lineage progenitor development

Affiliations

GATA-3 is required for early T lineage progenitor development

Tomonori Hosoya et al. J Exp Med. .

Abstract

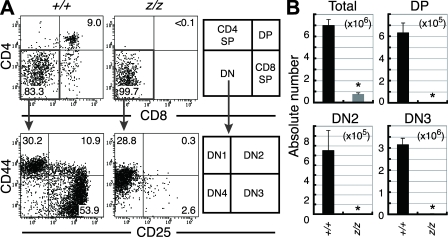
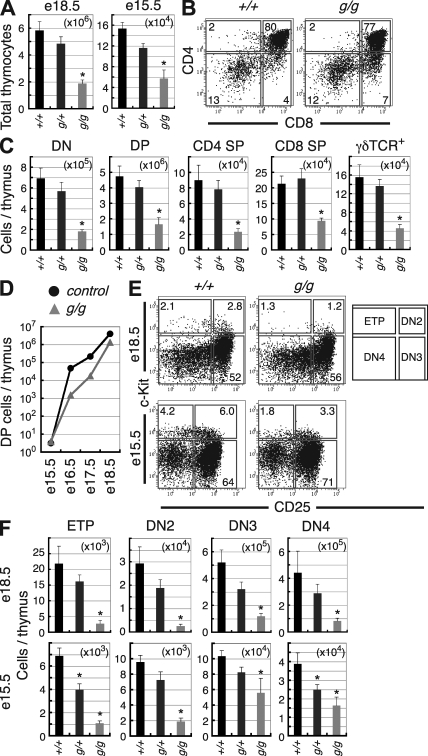
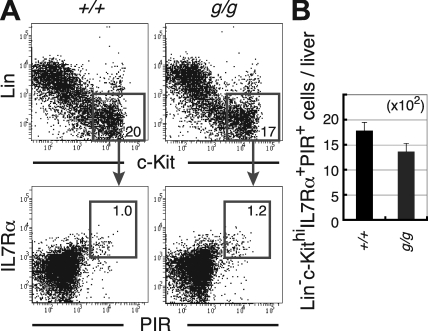
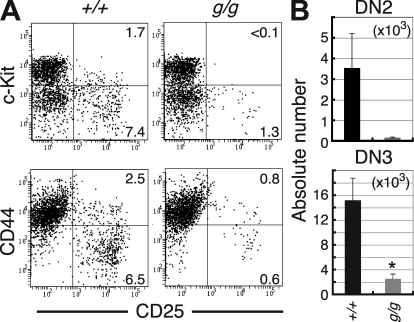
Most T lymphocytes appear to arise from very rare early T lineage progenitors (ETPs) in the thymus, but the transcriptional programs that specify ETP generation are not completely known. The transcription factor GATA-3 is required for the development of T lymphocytes at multiple late differentiation steps as well as for the development of thymic natural killer cells. However, a role for GATA-3 before the double-negative (DN) 3 stage of T cell development has to date been obscured both by the developmental heterogeneity of DN1 thymocytes and the paucity of ETPs. We provide multiple lines of in vivo evidence through the analysis of T cell development in Gata3 hypomorphic mutant embryos, in irradiated mice reconstituted with Gata3 mutant hematopoietic cells, and in mice conditionally ablated for the Gata3 gene to show that GATA-3 is required for ETP generation. We further show that Gata3 loss does not affect hematopoietic stem cells or multipotent hematopoietic progenitors. Finally, we demonstrate that Gata3 mutant lymphoid progenitors exhibit neither increased apoptosis nor diminished cell-cycle progression. Thus, GATA-3 is required for the cell-autonomous development of the earliest characterized thymic T cell progenitors.


Figures

Figure 1.
Figure 1.
GATA-3 is required for the generation of DN2 and later stage thymocytes in vitro. (A) 2 × 10⁵ fetal liver cells isolated from e12.5 Gata3z/z or Gata3+/+ embryos were grown in OP9-DL1 co-culture for 8 d to induce T cell development, and analyzed for CD4 and CD8 surface expression. The DN subpopulation was then analyzed for the expression of CD44 and CD25 markers to discriminate among the DN subpopulations. Data are representative of three or four embryos of each genotype from a single independent experiment. Numbers in quadrants indicated the mean percentage of cells in those sectors. Similar results were obtained when e12.5 or e13.5 fetal liver cells were cultured on OP9-DL1 cells for 6 or 7 d under the same culture conditions. (B) The absolute numbers of total, CD4CD8CD44hiCD25+ (DN2), CD4CD8CD44loCD25+ (DN3), and DP thymocytes were determined 8 d after fetal liver cells from e12.5 Gata3z/z and Gata3+/+ embryos were induced to differentiate in vitro. Residual OP9-DL1 cells were gated out by their expression of eGFP. Three to four embryos of each genotype from a single independent experiment were characterized; error bars indicate SEM. Similar reduction of DN2, DN3, and DP cells was observed when e12.5 or e13.5 fetal liver cells were cultured on OP9-DL1 cells for 6 or 7 d under the same culture conditions. *, P < 0.05.
Figure 2.
Figure 2.
Fewer immature T cells in Gata3 hypomorphic mutant embryos. (A) The absolute numbers of total thymocytes in Gata3g/g, Gata3g/+, and Gata3+/+ fetal thymi (7–20 mice of each genotype) were quantified. Data represent the summary of at least four independent experiments for each stage (means ± SEM). *, P < 0.01. (B) Thymocytes from e18.5 Gata3g/g and Gata3+/+ embryos were analyzed for CD4 and CD8 surface expression. Data are representative of six to eight embryos of each genotype from five independent experiments. Numbers in boxed areas indicate the mean percentage of cells in those quadrants. (C) The absolute numbers of DN, DP, CD4 SP, CD8 SP, and γδTCR+ cells per thymus in e18.5 Gata3g/g, Gata3g/+, and Gata3+/+ embryos are shown. Data represent the summary of five independent experiments, and the mean of six to eight embryo in each genotype with SEM. *, P < 0.05. (D) The absolute number of DP cells per thymus in Gata3g/g embryos compared with controls (both Gata3g/+ and Gata3+/+) embryos. An average of two to six mice of each genotype were shown. (E) Surface expression of c-Kit and CD25 on Linlo thymocytes isolated from e15.5 and e18.5 Gata3g/g and Gata3+/+ embryos. Data are representative of four to eight embryos of each genotype from at least two independent experiments for each stage. Numbers in the boxed areas indicate the mean percentage of cells in those sectors. (F) The absolute numbers of ETPs, DN2, DN3, and DN4 cells per thymus in e15.5 and e18.5 Gata3g/g, Gata3g/+, and Gata3+/+ embryos. Data represent the summary of at least two independent experiments for each stage and an average of four to eight embryos in each genotype with SEM. *, P < 0.05.
Figure 3.
Figure 3.
Development of T-restricted progenitors in the e12.5 fetal liver. (A) Fetal liver cells isolated from e12.5 Gata3g/g or Gata3+/+ embryos were analyzed for surface expression of mature lineage markers and c-Kit; the Linc-Kithi subpopulations were further analyzed for IL-7Rα and PIR expression. Numbers in the boxed areas indicate the percentage of cells in those sectors. (B) The absolute number of Linc-KithiIL-7Rα+PIR+ (T-restricted progenitor) cells per e12.5 fetal liver in Gata3g/g and Gata3+/+ embryos. Data represent the summary of seven independent experiments and an average of 14–18 embryos in each genotype with SEM.
Figure 4.
Figure 4.
A hematopoietic cell–autonomous role for GATA-3 in the production of fetal DN thymocytes. (A) 105 fetal liver cells isolated from e12.5 Gata3g/g and control Gata3+/+ embryos were induced to undergo T cell development in OP9-DL1 co-culture for 6 d, and analyzed for surface expression of c-Kit, CD25, and CD44 in the Linlo population. Data are representative of three embryos of each genotype from one independent experiment; a similar result was obtained from sorted Linc-Kithi fetal liver cells. Numbers in each quadrant indicate the mean percentage of cells in those sectors. (B) The absolute number of Linloc-KithiCD25+ (DN2) and Linloc-KitloCD25+ (DN3) cells 6 d after induction of T cell development in vitro in OP9-DL1 co-culture from Gata3g/g or Gata3+/+ e12.5 fetal liver cells. Data represent one independent experiment, and an average of three embryos of each genotype are shown with SEM. Similar results were obtained when sorted Linc-Kithi fetal liver cells were cultured on OP9-DL1 cells for 6 d under the same culture conditions. *, P < 0.05.
Figure 5.
Figure 5.
Gata3 expression in adult thymocytes. (A) Thymocytes recovered from Gata3g/+ or Gata3+/+ mice at 6 wk of age were analyzed for expression of eGFP in CD45+ (Total), DN, DP, CD4 SP, CD8 SP, γδTCR+, and NK1.1+ populations (right). Representative flow cytometry data for five mice of each genotype from two independent experiments and gating on each population are shown (left). Numbers in the boxed sectors indicate the mean percentage of cells in those sectors. (B) Thymocytes recovered from Gata3g/+ mice at 6 wk of age were analyzed for expression of eGFP and surface CD4/CD8 (left); the CD4CD8 subpopulation was analyzed for expression of CD44 and CD25 (middle); and finally, the CD4CD8CD44hiCD25 (DN1) subpopulation was analyzed for expression of eGFP and surface NK1.1 (right). Representative data examining the profiles of five mice from two independent experiments are shown. Numbers in the boxed sectors and the final quadrants indicate the mean percentage of cells in those sectors.
Figure 6.
Figure 6.
A hematopoietic cell–autonomous role for GATA-3 in the generation of adult ETPs. (A) Experimental strategy for the hematopoietic reconstitution assay is schematically illustrated. (B) Peripheral blood cells were analyzed by flow cytometry at 7 and 10 wk after transplantation for expression of lineage-specific makers and CD45. The mean percentages of fetal liver donor-derived cells (CD45.2+CD45.1) in the T lymphoid (CD3+), B lymphoid (B220+), and myeloid (Mac1+Gr1+) compartments are shown. Data represent the summary of two independent experiments and an average of six recipient mice in each group with SEM. *, P < 0.001. (C) Thymocytes were isolated and analyzed for the expression of CD45.2 and CD45.1 in the ETPs, DN2, DN3, and DN4 populations 10 wk after transplantation. Data are representative of six recipients of each genotype from two independent experiments. Numbers in the boxed areas indicate the mean percentage of cells in those sectors. (D) Fetal liver donor-derived CD45.2+CD45.1 cell ratios (top) and absolute numbers (bottom) in each thymocyte or bone marrow cell population were determined by flow cytometry. Data represent the summary of two independent experiments and an average of six recipient mice in each group with SEM. *, P < 0.006. (E) Fetal liver donor-derived CD45.2+CD45.1 ratios and absolute numbers of γδTCR+ cells in adoptive transfer recipient thymi. Data represent the summary of two independent experiments and mean ratios (top) or numbers (bottom) of five to six recipient mice in each group with SEM. *, P < 0.001. (F) Fetal liver donor-derived CD45.2+CD45.1 cell ratios in LinAA4.1hiB220c-KitloIL-7Rα+ (CLP) and LinAA4.1hiB220+c-KitloIL-7Rα+ (Fr.A) populations were determined >19 wk after transplantation. Data represent the summary of two independent experiments and an average of six to nine recipient mice in each group with SEM.
Figure 7.
Figure 7.
GATA-3 is required for the generation of immature T cells in adult mice. (A) Thymocytes were isolated from Gata3flox/flox: TgMx1cre (f/f) and control Gata3flox/+: TgMx1cre (f/+) mice 3 wk after the first pI-pC injection, and were analyzed for surface expression of c-Kit and CD25 after Linlo segregation. Data are representative of four mice of each genotype from three independent experiments. Numbers in the boxed areas indicate the mean percentage of cells in those sectors. (B) The absolute numbers of total thymocytes, ETPs, DN2, DN3, and DN4 cells per thymus in f/f mice 3 wk after pI-pC injection in comparison to f/+ mice. Data represent the summary of three independent experiments and an average of four mice of each genotype with SEM. *, P < 0.002.
Figure 8.
Figure 8.
A function for GATA-3 in ETP generation. (A) Lineage-depleted fetal liver cells isolated from e14.5 Gata3z/z and control Gata3z/+ embryos were induced to undergo T cell differentiation in OP9-DL1 co-culture for 4 d, and then analyzed for surface expression of c-Kit and CD25 in the LinloCD27+ population. Data are representative of four embryos of each genotype from one independent experiment. Numbers in each quadrant indicate the mean percentage of cells in those sectors. (B) The absolute number of LinloCD27+, LinloCD27+cKithiCD25, and LinloCD27+cKitloCD25 cells 4 d after OP9-DL1 co-culture from Gata3z/z or Gata3z/+ e14.5 Lin fetal liver cells. Data represent one independent experiment and an average of four embryos of each genotype with SEM. A similar reduction of Gata3z/z LinloCD27+c-KithiCD25 cell numbers was observed when e12.5 Lin fetal liver cells were cultured on OP9-DL1 cells for 4 d under the same culture conditions. *, P < 0.005. (C) Profile of annexin V and PI staining in total cells and LinloCD27+cKithiCD25 cells 4 d after OP9-DL1 co-culture beginning with e14.5 Lin fetal liver cells. Data are representative of four embryos of each genotype. Numbers in the boxed areas indicate the mean percentage of cells in those sectors. (D) Ratio of annexin V+PI and annexin V+PI+ cells in LinloCD27+cKithiCD25 cells 4 d after OP9-DL1 co-culture in Gata3z/z or Gata3z/+ e14.5 Lin fetal liver cells. An average of four embryos of each genotype is shown with SEM. (E) Cell-cycle analysis in LinloCD27+cKithiCD25 cells 4 d after OP9-DL1 co-culture from e12.5 Lin fetal liver cells. Data are representative of three to six embryos of each genotype from two independent experiments. Numbers in the boxed areas indicate the mean percentage of cells in those sectors. (F) Ratio of cells in the G0/G1, S, and G2+M phases in the LinloCD27+cKithiCD25 population 4 d after OP9-DL1 co-culture from Gata3z/z (gray bars) or Gata3+/+ (black bars) e12.5 Lin fetal liver cells. Data represent the summary of two independent experiments and an average of three to six embryos of each genotype with SEM. *, P < 0.006.

Similar articles

Cited by

References

    1. Adolfsson J., Månsson R., Buza-Vidas N., Hultquist A., Liuba K., Jensen C.T., Bryder D., Yang L., Borge O.J., Thoren L.A., et al. 2005. Identification of Flt3+ lympho-myeloid stem cells lacking erythro-megakaryocytic potential: a revised road map for adult blood lineage commitment. Cell. 121:295–306 10.1016/j.cell.2005.02.013 - DOI - PubMed
    1. Akashi K., Traver D., Miyamoto T., Weissman I.L. 2000. A clonogenic common myeloid progenitor that gives rise to all myeloid lineages. Nature. 404:193–197 10.1038/35004599 - DOI - PubMed
    1. Allman D., Sambandam A., Kim S., Miller J.P., Pagan A., Well D., Meraz A., Bhandoola A. 2003. Thymopoiesis independent of common lymphoid progenitors. Nat. Immunol. 4:168–174 10.1038/ni878 - DOI - PubMed
    1. Amsen D., Antov A., Jankovic D., Sher A., Radtke F., Souabni A., Busslinger M., McCright B., Gridley T., Flavell R.A. 2007. Direct regulation of Gata3 expression determines the T helper differentiation potential of Notch. Immunity. 27:89–99 10.1016/j.immuni.2007.05.021 - DOI - PMC - PubMed
    1. Anderson M.K. 2006. At the crossroads: diverse roles of early thymocyte transcriptional regulators. Immunol. Rev. 209:191–211 10.1111/j.0105-2896.2006.00352.x - DOI - PubMed

Publication types

Substances