. 2009 Dec 15;69(24):9422-30.
doi: 10.1158/0008-5472.CAN-09-2236.

Global changes in processing of mRNA 3' untranslated regions characterize clinically distinct cancer subtypes

Affiliations

Global changes in processing of mRNA 3' untranslated regions characterize clinically distinct cancer subtypes

Priyam Singh et al. Cancer Res. .

Abstract

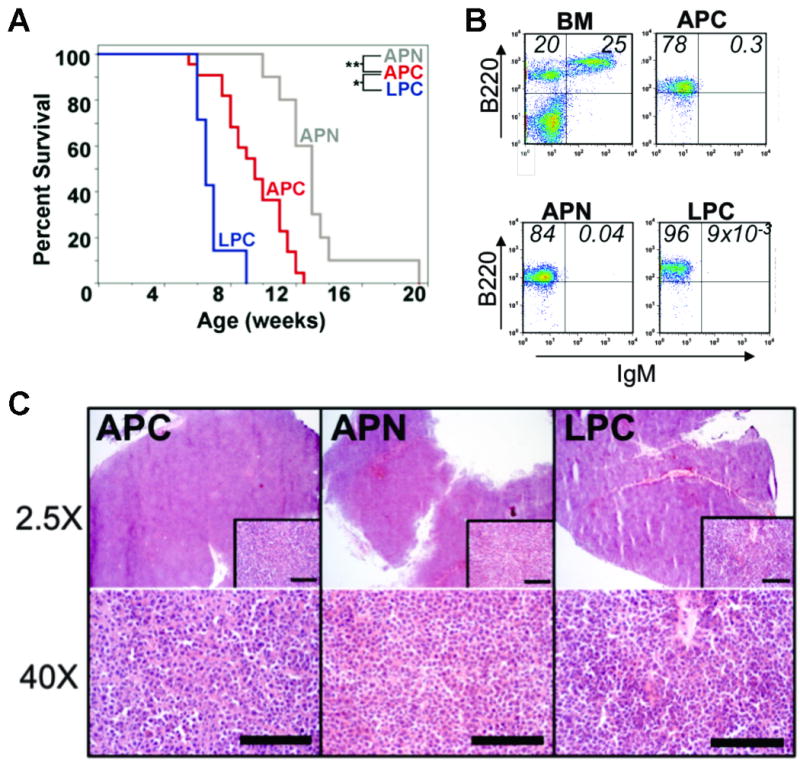
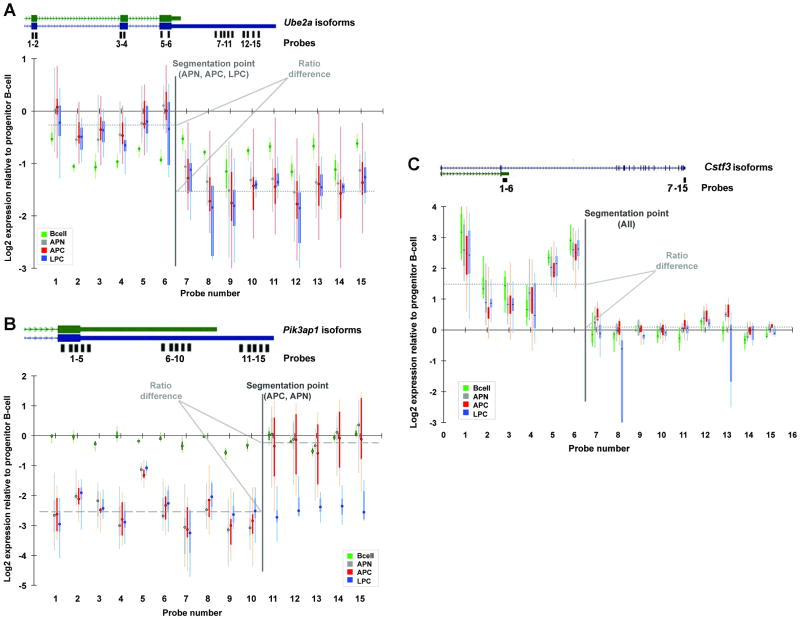
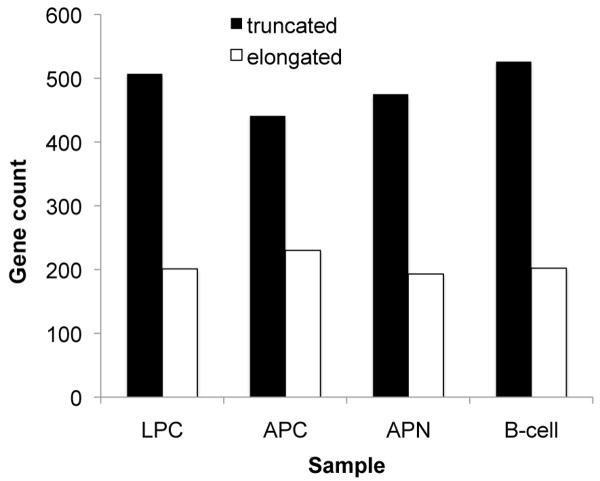
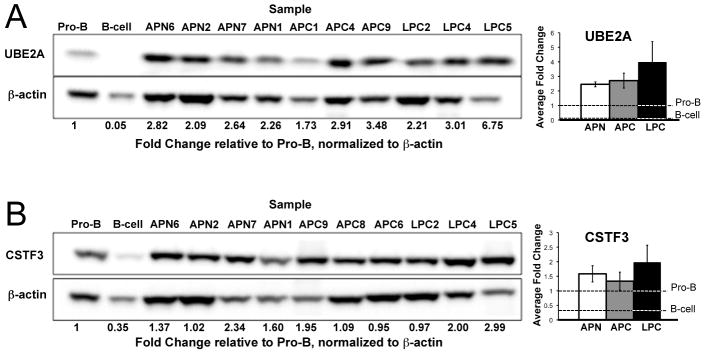
Molecular cancer diagnostics are an important clinical advance in cancer management, but new methods are still needed. In this context, gene expression signatures obtained by microarray represent a useful molecular diagnostic. Here, we describe novel probe-level microarray analyses that reveal connections between mRNA processing and neoplasia in multiple tumor types, with diagnostic potential. We now show that characteristic differences in mRNA processing, primarily in the 3'-untranslated region, define molecular signatures that can distinguish similar tumor subtypes with different survival characteristics, with at least 74% accuracy. Using a mouse model of B-cell leukemia/lymphoma, we find that differences in transcript isoform abundance are likely due to both alternative polyadenylation (APA) and differential degradation. While truncation of the 3'-UTR is the most common observed pattern, genes with elongated transcripts were also observed, and distinct groups of affected genes are found in related but distinct tumor types. Genes with elongated transcripts are overrepresented in ontology categories related to cell-cell adhesion and morphology. Analysis of microarray data from human primary tumor samples revealed similar phenomena. Western blot analysis of selected proteins confirms that changes in the 3'-UTR can correlate with changes in protein expression. Our work suggests that alternative mRNA processing, particularly APA, can be a powerful molecular biomarker with prognostic potential. Finally, these findings provide insights into the molecular mechanisms of gene deregulation in tumorigenesis.


Figures

Figure 1
Figure 1. Histologically similar Pro-B-cell lymphoma subtypes are distinguishable only by survival
(A) Kaplan-Meier survival analysis of APN (red), APC (blue), and LPC (gray) mice. Shown is percent surviving versus age in weeks. * p=6.96×10⁻⁵, ** p=1.95×10⁻⁶ (B) Flow cytometric analysis of normal bone marrow (BM), and APC, APN, or LPC lymphomas, using cells stained for the pan-B cell marker B220, and the developmental marker IgM. Percentages of B220+ IgM- (single positive) and B220+ IgM+ (double positive) cells are indicated in the corresponding quadrants. (C) Histological analysis of APC, APN, and LPC lymphomas. Hematoxylin and esosin (H&E) stained sections were imaged at 2.5× (upper panels) or 40× magnification (inset and lower panels). Scale bar = 400 × 10-6m
Figure 2
Figure 2. Probe-level analysis of microarray expression data reveals non-uniform changes in expression within genes
All plots shows base-2 logarithms of the ratio of normalized, background-corrected hybridization signal at each individual probe. Boxplots represent the observed values for 6 APN (gray), 11 APC (red), 6 LPC (blue), and 4 mature B-cell (green) measurements, each compared with 2 wildtype progenitor B-cell replicates. Positions of the probes along each gene are shown at the top of each plot. The ratio difference is the difference between the average base-2 logarithm expression change ratio on either side of the segmentation point. (A) Ube2a displays preferential loss of signal in the 3′-terminal portion of the transcript in all lymphoma subtypes, but uniform degradation in mature B-cells. (B) Pik3ap1 displays preferential loss of signal in the proximal 3′-UTR in APC and APN, uniform degradation in LPC, and no change in mature B-cells. (C) Cstf3 displays preferential gain in a truncated, non-translated transcript, potentially indicative of a feedback loop (37, 38). The Csft3 transcript is truncated in APN, APC, LPC and mature B-cells. The long and short isoforms are shown in blue.
Figure 3
Figure 3. Systematic changes in processing within the 3′-UTR imply trend toward net truncation of the 3′-UTR for all four samples
The plot shows the count of genes with relative loss (truncation, e.g., Ube2a) or gain (elongation, e.g., Pik3ap1) of hybridization signal in the distal 3′-UTR compared to the proximal 3′-UTR, with analysis limited to genes with one significant processing event.
Figure 4
Figure 4. Western blot analysis of UBE2A and CSTF3 protein reveals increased expression in lymphoma samples
(A) UBE2A protein abundance is increased in lymphoma cells compared to progenitor B-cells, in contrast to portion of the transcript containing the CDS (Figure 2a), suggesting the presence of a translation suppressing element in the extended 3′-UTR. (B) CSTF3 protein expression is increased in eight of 10 lymphoma samples, but significantly decreased in mature B-cells. Bar plots at right summarize the tumor types with bars showing the standard error.
Figure 5
Figure 5. Characteristic signatures of alternative processing
Blue and red indicate relative loss (e.g., Ube2a) or gain (e.g., Pik3ap1), of signal in downstream probes, respectively, and the intensity of the color reflects the ratio difference (Figure 2). Each column represents a single gene and segmentation point; each row represents the analysis of an individual microarray averaged over comparison with control microarrays. In this supervised clustering, genes were selected as those that best differentiated between samples. Bootstrapping probabilities are shown for selected clusters. Complete bootstrap results are available in Supplemental Figures S5-S7. (A) Mouse pro-B-cell lymphoma samples. Control samples were wildtype progenitor B-cells. (B) Human melanoma (GSE7553), including basal cell carcinoma (BCC), squamous cell carcinoma (SCC), primary melanoma (PM), and metastatic melanoma (MM) (43). Control samples were normal human skin. (C) Human breast cancer (GSE7904), including sporadic basal-like cancers (BLC), BRCA1associated cancers (BRCA1), and non BLC tumors (NBLC). Controls were normal human breast tissue.

References

    1. Bullinger L, Valk PJ. Gene expression profiling in acute myeloid leukemia. J Clin Oncol. 2005;23:6296–305. - PubMed
    1. Mano H. Stratification of acute myeloid leukemia based on gene expression profiles. Int J Hematol. 2004;80:389–94. - PubMed
    1. Mischel PS, Cloughesy TF, Nelson SF. DNA-microarray analysis of brain cancer: molecular classification for therapy. Nat Rev Neurosci. 2004;5:782–92. - PubMed
    1. Perez-Diez A, Morgun A, Shulzhenko N. Microarrays for cancer diagnosis and classification. Adv Exp Med Biol. 2007;593:74–85. - PubMed
    1. Kwan T, Benovoy D, Dias C, et al. Genome-wide analysis of transcript isoform variation in humans. Nat Genet. 2008;40:225–31. - PubMed

Publication types