. 2009 Dec;2(12):1065-75.
doi: 10.1158/1940-6207.CAPR-09-0010. Epub 2009 Nov 24.

Lack of evidence for green tea polyphenols as DNA methylation inhibitors in murine prostate

Affiliations

Lack of evidence for green tea polyphenols as DNA methylation inhibitors in murine prostate

Shannon R Morey Kinney et al. Cancer Prev Res (Phila). 2009 Dec.

Abstract

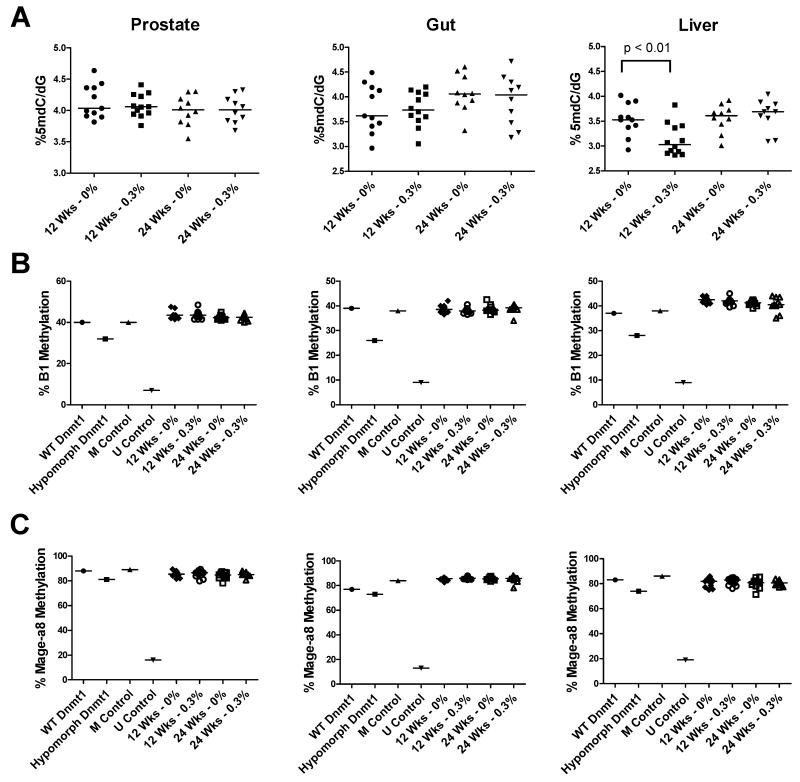
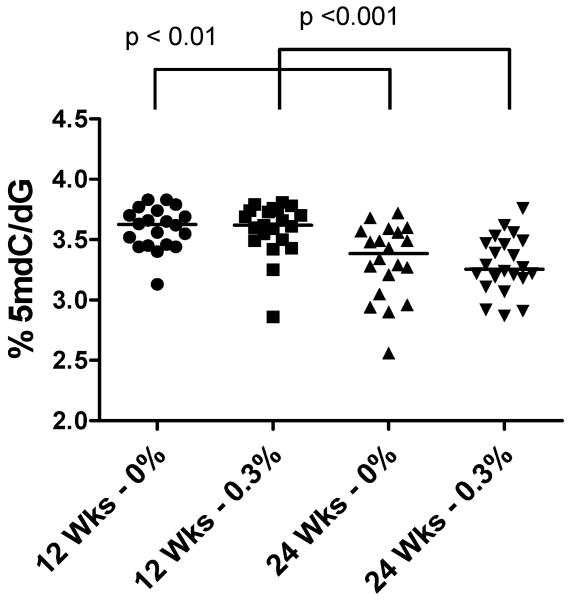
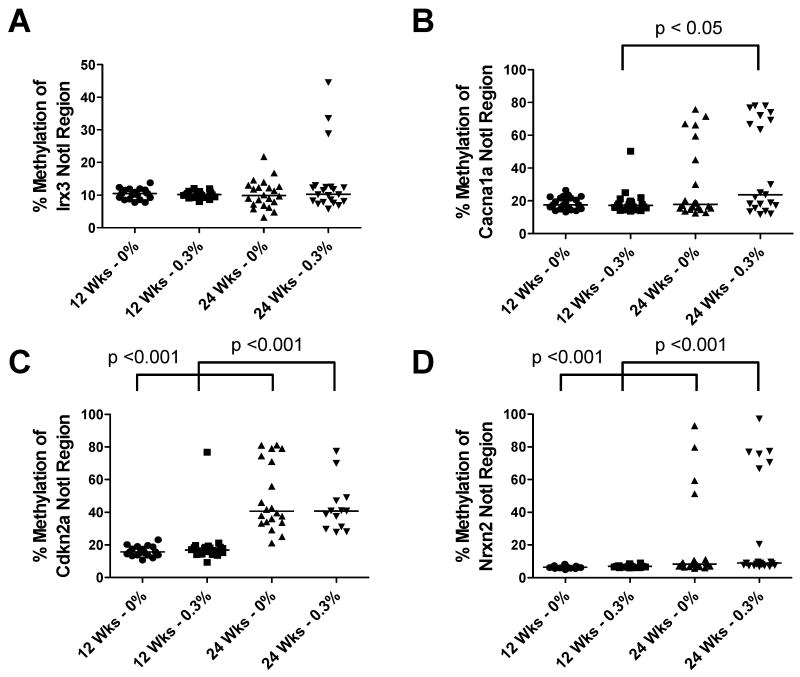
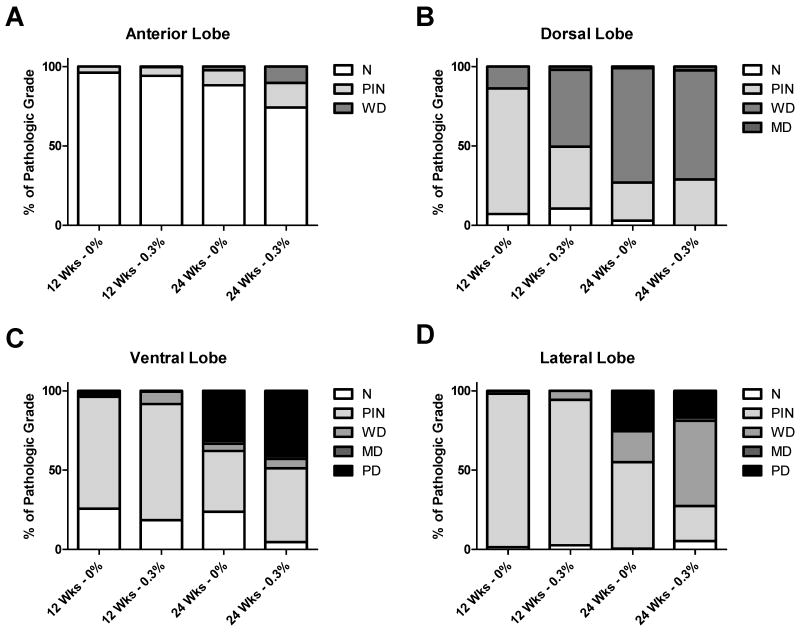
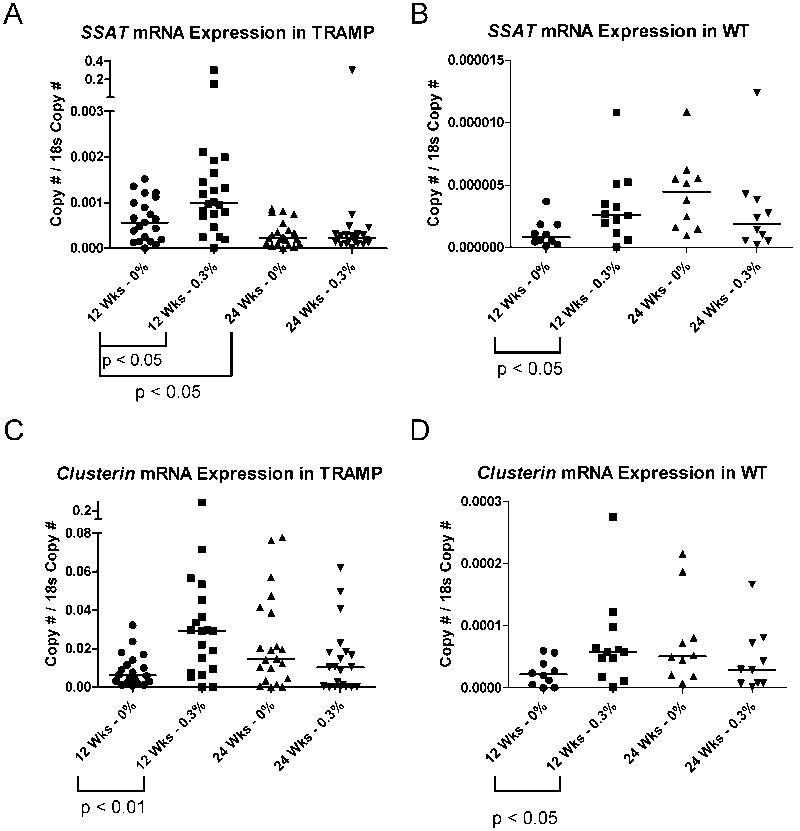
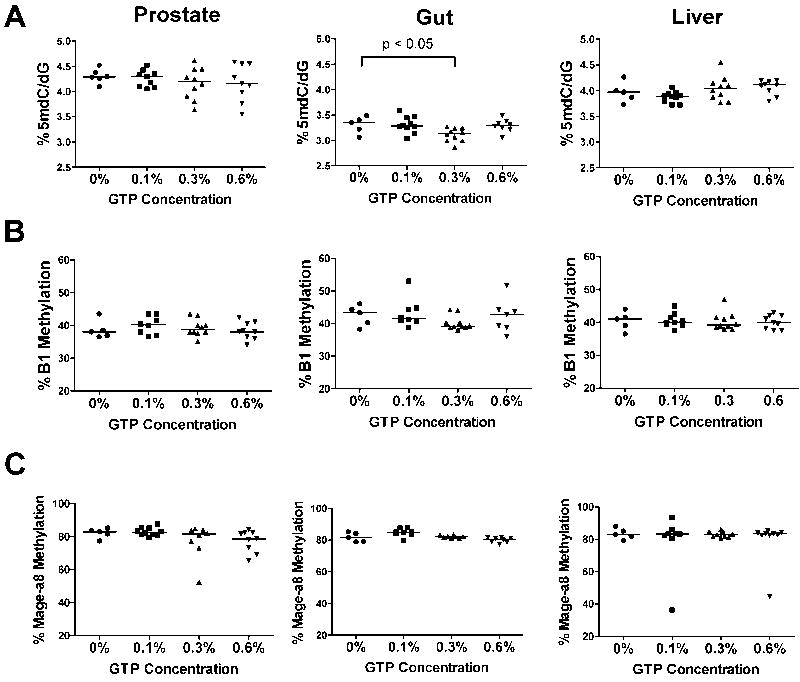
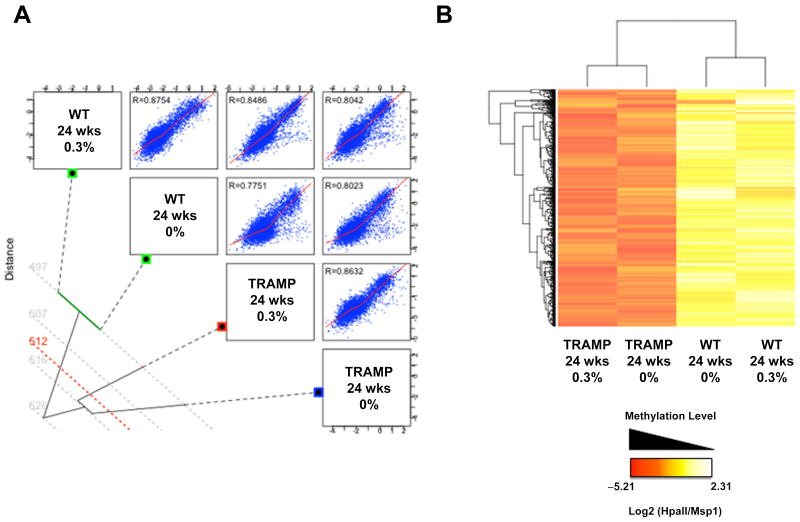
Green tea polyphenols (GTP) have been reported to inhibit DNA methylation in cultured cells. Here, we tested whether oral consumption of GTPs affects normal or cancer-specific DNA methylation in vivo, using mice. Wild-type (WT) and transgenic adenocarcinoma of mouse prostate (TRAMP) mice were given 0.3% GTPs in drinking water beginning at 4 weeks of age. To monitor DNA methylation, we measured 5-methyl-deoxycytidine (5mdC) levels, methylation of the B1 repetitive element, and methylation of the Mage-a8 gene. Each of these parameters were unchanged in prostate, gut, and liver from WT mice at both 12 and 24 weeks of age, with the single exception of a decrease of 5mdC in the liver at 12 weeks. In GTP-treated TRAMP mice, 5mdC levels and the methylation status of four loci hypermethylated during tumor progression were unaltered in TRAMP prostates at 12 or 24 weeks. Quite surprisingly, GTP treatment did not inhibit tumor progression in TRAMP mice, although known pharmacodynamic markers of GTPs were altered in both WT and TRAMP prostates. We also administered 0.1%, 0.3%, or 0.6% GTPs to TRAMP mice for 12 weeks and measured 5mdC levels and methylation of B1 and Mage-a8 in prostate, gut, and liver tissues. No dose-dependent alterations in DNA methylation status were observed. Genome-wide DNA methylation profiling using the HpaII tiny fragment enrichment by ligation-mediated PCR assay also revealed no significant hypomethylating effect of GTP. These data indicate that oral administration of GTPs does not affect normal or cancer-specific DNA methylation in the murine prostate.


Figures

Fig. 1
Fig. 1. Effect of GTP consumption on DNA methylation in wild-type (WT) mice
A) 5mdC levels in prostate, gut, and liver tissue in control or GTP-treated WT mice at 12 and 24 weeks of age was measured by LC-MS as described in Materials and Methods. B) B1 repetitive element methylation in prostate, gut, and liver tissue in control or GTP-treated WT mice at 12 and 24 weeks of age was measured by bisulfite pyrosequencing as described in Materials and Methods. C) Mage-a8 methylation in prostate, gut, and liver tissue in control or GTP-treated WT mice at 12 and 24 weeks of age by bisulfite pyrosequencing as described in Materials and Methods. Mice were administered GTPs beginning at 4 weeks of age. Organ matched DNA was used from WT or Dnmt1 hypomorphic mice in addition to in vitro methylated (M Control) and unmethylated (U Control) DNA as controls. Each symbol represents an individual sample and the bar indicates the median of each group. Mann-Whitney Test was used to determine significant differences.
Fig. 2
Fig. 2. Effect of GTP consumption on 5mdC levels in TRAMP mice
5mdC levels in prostate from control or GTP-treated TRAMP mice at 12 and 24 weeks of age was determined by LC-MS analysis as described in Materials and Methods. Mice were administered GTPs beginning at 4 weeks of age. Each symbol represents an individual sample and the bar indicates the median of each group. Mann-Whitney Test was used to determine significant differences.
Fig. 3
Fig. 3. Effect of GTP consumption on locus-specific DNA hypermethylation in TRAMP mice
Methylation of Irx3 (A), Cacna1a (B), Cdkn2a (C), and Nrxn2 (D) in prostate tissue from control or GTP-treated TRAMP mice at 12 and 24 weeks of age was determined by MAQMA analysis as described in Materials and Methods. Mice were administered GTPs beginning at 4 weeks of age. Each symbol represents an individual sample and the bar indicates the median of each group. Mann-Whitney Test was used to determine significant differences.
Fig. 4
Fig. 4. Effect of GTP consumption on prostate cancer in TRAMP mice
Microscopic analysis of hematoxylin and eosin staining of prostate tissue from control and GTP-treated TRAMP mice at 12 and 24 weeks of age. Percent of each pathological grade (N-Normal, PIN-Prostatic Intraepithelial Neoplasia, WD-Well Differentiated, MD-Moderately Differentiated, PD-Poorly Differentiated) was determined and averaged for all of the animals in each group for the four lobes of mouse prostate: A) Anterior, B) Dorsal, C) Ventral, and D) Lateral. One section from the prostate of each mouse was analyzed at 40× magnification to score pathological grade.
Fig. 5
Fig. 5. Ssat and Clusterin are upregulated in TRAMP and WT prostates following 0.3% GTP treatment
A) Ssat mRNA expression in prostates from either control or GTP-treated TRAMP mice at 12 and 24 weeks of age was measured by qRT-PCR as described in Materials and Methods. B) Ssat mRNA expression in prostates from control or GTP-treated WT mice at 12 and 24 weeks of age was measured by qRT-PCR as described in Materials and Methods. C) Clusterin mRNA expression in prostates from control or GTP-treated TRAMP mice at 12 and 24 weeks of age was measured by qRT-PCR as described in Materials and Methods. D) Clusterin mRNA expression in prostates from control or GTP-treated WT mice at 12 and 24 weeks of age was measured by qRT-PCR as described in Materials and Methods. Mice were administered GTPs beginning at 4 weeks of age. Each symbol represents an individual sample and the bar indicates the median of each group. Mann-Whitney Test was used to determine significant differences.
Fig. 6
Fig. 6. Effect of GTP consumption on DNA methylation in TRAMP mice over a range of concentrations
A) 5mdC levels in prostate, gut, and liver tissue from control or GTP-treated TRAMP mice at 18 weeks of age was determined by LC-MS analysis as described in Materials and Methods. B) B1 repetitive element methylation in prostate, gut, and liver tissue from control or GTP-treated TRAMP mice at 18 weeks of age was determined by bisulfite pyrosequencing as described in Materials and Methods. C) Mage-a8 methylation in prostate, gut, and liver tissue from control or GTP-treated TRAMP mice at 18 weeks of age was determined by bisulfite pyrosequencing as described in Materials and Methods. Mice were administered GTPs beginning at 6 weeks of age. Each symbol represents an individual sample and the bar indicates the median of each group. Mann-Whitney Test was used to determine significant differences.
Fig 7
Fig 7. Genome-wide DNA methylation profiling of GTP-treated normal murine prostate and TRAMP prostate using HELP assays
WT and TRAMP prostate tissues were collected at 24 weeks of age, following 18 weeks of treatment with either 0% or 0.3% GTPs. Genomic DNAs were harvested and utilized for global DNA methylation analysis at HpaII sites using the high-resolution HELP assay, as described in the Materials and Methods. A) Unsupervised clustering of HELP and global Pairwise (Pearson) correlations is shown. R values indicate the Pearson correlation for each pair. The data illustrate a consistent pattern of methylation between the two WT samples (R=0.8754), as well as the two TRAMP samples (R=0.8632). In contrast, there was divergence in the methylation pattern of the WT samples versus the TRAMP samples (mean R value=0.8075). B) Two-dimensional hierarchical clustering of genes differentially methylated between TRAMP and WT, illustrated by a heatmap. Supervised analysis identified 2035 HpaII-amplifiable fragments with a log2 ratio (HpaII/MspI) of >1.3 between TRAMP and WT. The heat map illustrates 1000 random points selected from this group. Cases are represented in the columns; probe sets are represented in the rows. The data illustrates a high similarity of the DNA methylation pattern in the 0% and 0.3% GTP treatment groups in either sample type (WT or TRAMP), for the loci that are hypermethylated in TRAMP.

Similar articles

Cited by

References

    1. NCI. SEER Cancer Statistics Review 1975-2005. 2007
    1. Nelson PS, Montgomery B. Unconventional therapy for prostate cancer: good, bad or questionable? Nat Rev Cancer. 2003;3:845–58. - PubMed
    1. Nelson WG, Yegnasubramanian S, Agoston AT, et al. Abnormal DNA methylation, epigenetics, and prostate cancer. Front Biosci. 2007;12:4254–66. - PubMed
    1. Gronbaek K, Hother C, Jones PA. Epigenetic changes in cancer. APMIS. 2007;115:1039–59. - PubMed
    1. Ghoshal K, Bai S. DNA methyltransferases as targets for cancer therapy. Drugs Today (Barc) 2007;43:395–422. - PubMed

Publication types

MeSH terms