. 2009 Nov;21(11):3554-66.
doi: 10.1105/tpc.108.064980. Epub 2009 Nov 24.

The WRKY6 transcription factor modulates PHOSPHATE1 expression in response to low Pi stress in Arabidopsis

Affiliations

The WRKY6 transcription factor modulates PHOSPHATE1 expression in response to low Pi stress in Arabidopsis

Yi-Fang Chen et al. Plant Cell. 2009 Nov.

Abstract

Arabidopsis thaliana WRKY family comprises 74 members and some of them are involved in plant responses to biotic and abiotic stresses. This study demonstrated that WRKY6 is involved in Arabidopsis responses to low-Pi stress through regulating PHOSPHATE1 (PHO1) expression. WRKY6 overexpression lines, similar to the pho1 mutant, were more sensitive to low Pi stress and had lower Pi contents in shoots compared with wild-type seedlings and the wrky6-1 mutant. Immunoprecipitation assays demonstrated that WRKY6 can bind to two W-boxes of the PHO1 promoter. RNA gel blot and beta-glucuronidase activity assays showed that PHO1 expression was repressed in WRKY6-overexpressing lines and enhanced in the wrky6-1 mutant. Low Pi treatment reduced WRKY6 binding to the PHO1 promoter, which indicates that PHO1 regulation by WRKY6 is Pi dependent and that low Pi treatment may release inhibition of PHO1 expression. Protein gel blot analysis showed that the decrease in WRKY6 protein induced by low Pi treatment was inhibited by a 26S proteosome inhibitor, MG132, suggesting that low Pi-induced release of PHO1 repression may result from 26S proteosome-mediated proteolysis. In addition, WRKY42 also showed binding to W-boxes of the PHO1 promoter and repressed PHO1 expression. Our results demonstrate that WRKY6 and WRKY42 are involved in Arabidopsis responses to low Pi stress by regulation of PHO1 expression.


Figures

Figure 1.
Figure 1.
Phenotype Tests of Various Plant Materials. (A) Phenotype comparison of the WRKY6-overexpressing line (35S:WRKY6-9), the WRKY6 En-1 insertion mutant (wrky6-1), the pho1 mutant, and wild-type (Columbia-0 [Col-0]) plants. All plants were grown in a potting soil mixture (rich soil:vermiculite = 2:1, v/v) and kept in growth chambers at 22°C with illumination at 120 μmol·m−2·s−1 for an 18-h daily light period for 30 d. (B) RT-PCR test of WRKY6 expression in the wrky6-1 mutant and wild-type seedlings. Seven-day-old seedlings were used for RNA extraction. EF1α was amplified for the control. (C) RNA gel blot analysis of WRKY6 expression in the WRKY6-overexpressing lines (Super:WRKY6-13, Super:WRKY6-18, and 35S:WRKY6-9) and the wrky6-1 mutant. Seven-day-old seedlings were used for RNAs extracted. The ethidium bromide–stained rRNA band was shown for the loading controls. (D) Phenotype comparison of the various plant lines as indicated. The 7-d-old seedlings germinated on MS medium were transferred to MS (top panel) or LP (bottom panel) medium for another 7 d.
Figure 2.
Figure 2.
Pi Content Measurements in Various Plant Materials. The 7-d-old seedlings of WRKY6-overexpressing lines (Super:WRKY6-13, Super:WRKY6-18, and 35S:WRKY6-9), the wrky6-1 mutant, the pho1 mutant, and wild-type plants germinated on MS medium were transferred to MS ([A] and [C]) or LP ([B] and [D]) medium for another 7 d, and then the shoots and roots of the seedlings were harvested separately for Pi content measurements. (A) and (B) Pi contents in roots and shoots of tested plant materials. Three replicates were included for each treatment, and experiments were repeated three times. Data are shown as means ± se (n = 3). (C) and (D) Comparison of the ratio of Pishoot to Piroot. The ratio was calculated from the data presented in (A) and (B). Data are shown as means ± se (n = 3).
Figure 3.
Figure 3.
ChIP Assays for At WRKY6 Binding to the W-Box of the PHO1 Promoter in Vivo. (A) Diagram of the PHO1 promoter region showing the relative positions of four of six W-boxes (Q, −1718 to −1625; X, −1269 to −1181; Y, −966 to −936; and Z, −775 to −618). W-boxes are marked by black rectangles, and the untranslated region and exons of PHO1 are marked by gray boxes. (B) ChIP-qPCR analysis of the PHO1 promoter sequence. ChIP assays were performed with chromatin prepared from wild-type Arabidopsis roots. The gray and black bars represent the ChIP signals with (WRKY6) and without (NoAB) addition of anti-WRKY6 serum, respectively. The experiments were repeated three times, and three replicates were included for each sample in each experiment. The data are presented as means ± se (n = 3).
Figure 4.
Figure 4.
Suppression of PHO1 Expression by WRKY6. (A) RNA gel blot analysis of PHO1 expression in the roots of the WRKY6-overexpressing lines (Super:WRKY6-13, Super:WRKY6-18, and 35S:WRKY6-9), the wrky6-1 mutants, and wild-type plants. rRNA is shown as a loading control. (B) to (D) GUS staining showing expression patterns of PHO1 in transgenic plants carrying distinct PHO1 promoter constructs (indicated above each panel; green boxes show W boxes, and yellow box represents the GUS gene) in 35S:WRKY6-9, wrky6-1 mutant, or wild-type backgrounds. The three roots in each group are representatives from three independent transgenic lines for each background. All PHO1 promoter–driven GUS transgenic lines are homozygous lines, and each line contains a single copy of insertion. (E) Relative GUS activities in different transgenic plants.
Figure 5.
Figure 5.
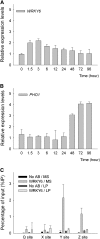
Repression of PHO1 Expression by WRKY6 Was Released in Response to Low Pi Stress. (A) qPCR analysis of WRKY6 expression induced by Pi starvation. (B) qPCR analysis of PHO1 expression induced by Pi starvation. (C) ChIP-qPCR assays to detect the association between WRKY6 and W-boxes within the PHO1 promoter in wild-type plants under the normal (MS) and LP conditions. The ChIP signals with (WRKY6) and without (NoAB) addition of anti-WRKY6 serum are indicated. The data are presented as means ± se (n = 3). The experiments were repeated three times, and three replicates were included for each sample in each experiment.
Figure 6.
Figure 6.
ChIP-qPCR Assays to Detect the Association of WRKY6 and the PHO1 Promoter in the Tested Plants as Indicated under Pi-Sufficient (MS) and Pi-Deficient (LP) Conditions. ChIP assays were performed with chromatin prepared from tested plants roots to analyze the binding of At WRKY6 protein to the WQ-box ([A]; Q site), WX-box ([B]; X site), WY-box ([C]; Y site), and WZ-box ([D]; Z site) of the PHO1 promoter in vivo. The ChIP signals with (WRKY6) and without (NoAB) addition of anti-WRKY6 serum are indicated. The experiments were repeated three times, and three replicates were included for each sample in one experiment. The data are presented as means ± se (n = 3).
Figure 7.
Figure 7.
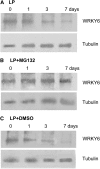
WRKY6 Protein Blot Analysis. Seven-day-old wild-type seedlings were transferred to LP medium (A), LP medium with 10 μM MG132 (LP+MG132) (B), or LP medium with DMSO (LP+DMSO) (C). The roots of seedlings were harvested for protein extraction at the indicated time. Protein extracts were analyzed by immunoblots using rabbit anti-WRKY6 serum. Tubulin levels were detected in parallel as a loading control with antitubulin antibody.
Figure 8.
Figure 8.
Suppression of PHO1 Expression by WRKY42. (A) ChIP-qPCR assays to detect the association between WRKY42 and W-boxes within the PHO1 promoter in wild-type plants under normal conditions. The experiments were repeated three times, and three replicates were included for each sample in each experiment. The data are presented as means ± se (n = 3). (B) Transient overexpression of the ProPHO1:GUS fusion together with Super:WRKY6, Super:WRKY42, or Super:WRKY75 in Nicotiana benthamiana leaves. ProPHO1:GUS fusion together with Super1300 vector was taken as the control. The data are presented as means ± se (n = 4).

References

    1. Ames, B.N. (1966). Assay of inorganic phosphate, total phosphate and phosphatases. Methods Enzymol. 8 115–118.
    1. Aung, K., Lin, S.I., Wu, C.C., Huang, Y.T., Su, C.L., and Chiou, T.J. (2006). pho2, a phosphate overaccumulator, is caused by a nonsense mutation in a microRNA399 target gene. Plant Physiol. 141 1000–1011. - PMC - PubMed
    1. Bari, R., Datt Pant, D., Stitt, M., and Scheible, W.R. (2006). PHO2, microRNA399, and PHR1 define a phosphate-signaling pathway in plants. Plant Physiol. 141 988–999. - PMC - PubMed
    1. Chen, Z., Nimmo, G.A., Jenkins, G.I., and Nimmo, H.G. (2007). BHLH32 modulates several biochemical and morphological processes that respond to Pi starvation in Arabidopsis. Biochem. J. 405 191–198. - PMC - PubMed
    1. Chiou, T.J., Aung, K., Lin, S.I., Wu, C.C., Chiang, S.F., and Su, C.L. (2006). Regulation of phosphate homeostasis by microRNA in Arabidopsis. Plant Cell 18 412–421. - PMC - PubMed

Publication types

MeSH terms

Associated data