

Portal glucose infusion-glucose clamp measures hepatic influence on postprandial systemic glucose appearance as well as whole body glucose disposal
- PMID: 19934401
- PMCID: PMC2822487
- DOI: 10.1152/ajpendo.00280.2009
Portal glucose infusion-glucose clamp measures hepatic influence on postprandial systemic glucose appearance as well as whole body glucose disposal
Abstract
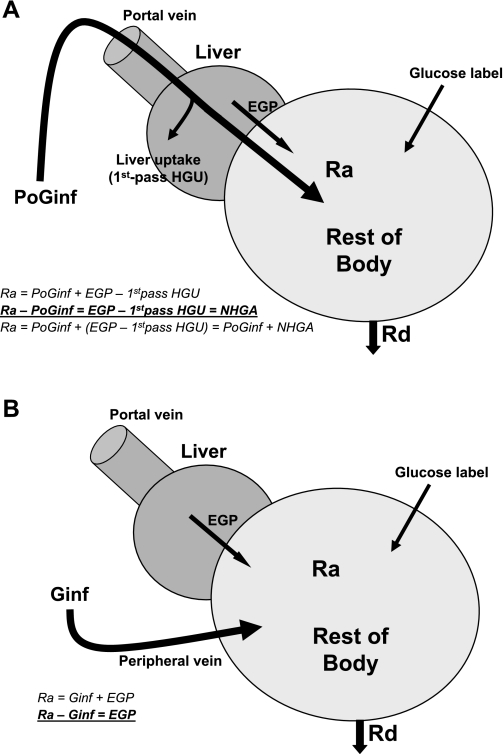
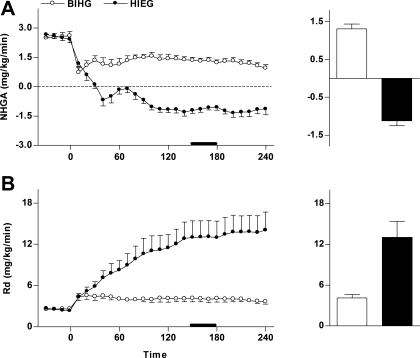
The full impact of the liver, through both glucose production and uptake, on systemic glucose appearance cannot be readily studied in a classical glucose clamp because hepatic glucose metabolism is regulated not only by portal insulin and glucose levels but also portal glucose delivery (the portal signal). In the present study, we modified the classical glucose clamp by giving exogenous glucose through portal vein, the "portal glucose infusion (PoG)-glucose clamp", to determine the net hepatic effect on postprandial systemic glucose supply along with the measurement of whole body glucose disposal. By comparing systemic rate of glucose appearance (R(a)) with portal glucose infusion rate (PoG(inf)), we quantified "net hepatic glucose addition (NHGA)" in the place of endogenous glucose production determined in a regular clamp. When PoG-glucose clamps (n = 6) were performed in dogs at basal insulinemia and hyperglycemia ( approximately 150 mg/dl, portal and systemic), we measured consistently higher R(a) than PoG(inf) (4.2 +/- 0.6 vs. 2.9 +/- 0.6 mg x kg(-1) x min(-1) at steady state, P < 0.001) and thus positive NHGA at 1.3 +/- 0.1 mg x kg(-1) x min(-1), identifying net hepatic addition of glucose to portal exogenous glucose. In contrast, when PoG-glucose clamps (n = 6) were performed at hyperinsulinemia ( approximately 250 pmol/l) and systemic euglycemia (portal hyperglycemia due to portal glucose infusion), we measured consistently lower R(a) than PoG(inf) (13.1 +/- 2.4 vs. 14.3 +/- 2.4 mg x kg(-1) x min(-1), P < 0.001), and therefore negative NHGA at -1.1 +/- 0.1 mg x kg(-1) x min(-1), identifying a switch of the liver from net production to net uptake of portal exogenous glucose. Steady-state whole body glucose disposal was 4.1 +/- 0.5 and 13.0 +/- 2.4 mg x kg(-1) x min(-1), respectively, determined as in a classical glucose clamp. We conclude that the PoG-glucose clamp, simulating postprandial glucose entry and metabolism, enables simultaneous assessment of the net hepatic effect on postprandial systemic glucose supply as well as whole body glucose disposal in various animal models (rodents, dogs, and pigs) with established portal vein catheterization.
Figures


Similar articles
-
Exenatide sensitizes insulin-mediated whole-body glucose disposal and promotes uptake of exogenous glucose by the liver.Diabetes. 2009 Feb;58(2):352-9. doi: 10.2337/db08-0875. Epub 2008 Nov 14. Diabetes. 2009. PMID: 19011168 Free PMC article.
-
Basal hepatic glucose production is regulated by the portal vein insulin concentration.Diabetes. 1998 Apr;47(4):523-9. doi: 10.2337/diabetes.47.4.523. Diabetes. 1998. PMID: 9568682
-
Portal venous 5-aminoimidazole-4-carboxamide-1-beta-D-ribofuranoside infusion overcomes hyperinsulinemic suppression of endogenous glucose output.Diabetes. 2005 Feb;54(2):373-82. doi: 10.2337/diabetes.54.2.373. Diabetes. 2005. PMID: 15677495
-
Inclusion of low amounts of fructose with an intraduodenal glucose load markedly reduces postprandial hyperglycemia and hyperinsulinemia in the conscious dog.Diabetes. 2002 Feb;51(2):469-78. doi: 10.2337/diabetes.51.2.469. Diabetes. 2002. PMID: 11812757
-
Regulation of hepatic glucose uptake and storage in vivo.Adv Nutr. 2012 May 1;3(3):286-94. doi: 10.3945/an.112.002089. Adv Nutr. 2012. PMID: 22585902 Free PMC article. Review.
Cited by
-
PAHSAs enhance hepatic and systemic insulin sensitivity through direct and indirect mechanisms.J Clin Invest. 2019 Oct 1;129(10):4138-4150. doi: 10.1172/JCI127092. J Clin Invest. 2019. PMID: 31449056 Free PMC article.
-
Development of a Diabetes Dietary Quality Index: Reproducibility and Associations with Measures of Insulin Resistance, Beta Cell Function, and Hyperglycemia.Nutrients. 2024 Oct 16;16(20):3512. doi: 10.3390/nu16203512. Nutrients. 2024. PMID: 39458507 Free PMC article.
-
Metabolic response to high-carbohydrate and low-carbohydrate meals in a nonhuman primate model.Am J Physiol Endocrinol Metab. 2013 Feb 15;304(4):E444-51. doi: 10.1152/ajpendo.00347.2012. Epub 2012 Dec 26. Am J Physiol Endocrinol Metab. 2013. PMID: 23269412 Free PMC article.
-
Estimating hepatic glucokinase activity using a simple model of lactate kinetics.Diabetes Care. 2012 May;35(5):1015-20. doi: 10.2337/dc11-1540. Epub 2012 Mar 28. Diabetes Care. 2012. PMID: 22456868 Free PMC article.
-
Mammalian models of diabetes mellitus, with a focus on type 2 diabetes mellitus.Nat Rev Endocrinol. 2023 Jun;19(6):350-360. doi: 10.1038/s41574-023-00818-3. Epub 2023 Mar 20. Nat Rev Endocrinol. 2023. PMID: 36941447 Review.
References
-
- Abumrad NN, Cherrington AD, Williams PE, Lacy WW, Rabin D. Absorption and disposition of a glucose load in the conscious dog. Am J Physiol Endocrinol Metab 242: E398–E406, 1982 - PubMed
-
- Barrett EJ, Ferrannini E, Gusberg R, Bevilacqua S, DeFronzo RA. Hepatic and extrahepatic splanchnic glucose metabolism in the postabsorptive and glucose fed dog. Metabolism 34: 410–420, 1985 - PubMed
-
- Bergman RN, Beir JR, Hourigan PM. Intraportal glucose infusion matched to oral glucose absorption. Lack of evidence for “gut factor” involvement in hepatic glucose storage. Diabetes 31: 27–35, 1982 - PubMed
-
- Bergman RN, Hope ID, Yang YJ, Watanabe RM, Meador MA, Youn JH, Ader M. Assessment of insulin sensitivity in vivo: a critical review. Diabetes Metab Rev 5: 411–429, 1989 - PubMed
Publication types
MeSH terms
Substances
Grants and funding
LinkOut - more resources
Full Text Sources
Other Literature Sources
Medical
Miscellaneous