. 2010 Mar;298(3):E449-66.
doi: 10.1152/ajpendo.00559.2009. Epub 2009 Nov 24.

Predicting metabolic adaptation, body weight change, and energy intake in humans

Affiliations

Predicting metabolic adaptation, body weight change, and energy intake in humans

Kevin D Hall. Am J Physiol Endocrinol Metab. 2010 Mar.

Abstract

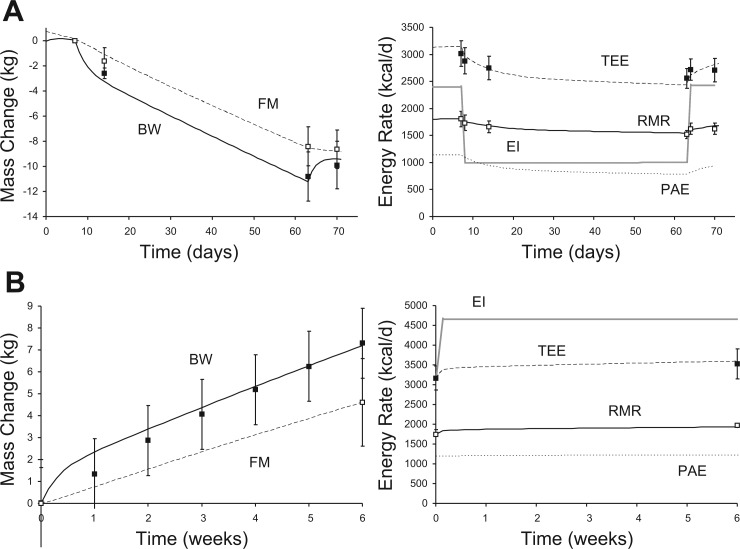
Complex interactions between carbohydrate, fat, and protein metabolism underlie the body's remarkable ability to adapt to a variety of diets. But any imbalances between the intake and utilization rates of these macronutrients will result in changes in body weight and composition. Here, I present the first computational model that simulates how diet perturbations result in adaptations of fuel selection and energy expenditure that predict body weight and composition changes in both obese and nonobese men and women. No model parameters were adjusted to fit these data other than the initial conditions for each subject group (e.g., initial body weight and body fat mass). The model provides the first realistic simulations of how diet perturbations result in adaptations of whole body energy expenditure, fuel selection, and various metabolic fluxes that ultimately give rise to body weight change. The validated model was used to estimate free-living energy intake during a long-term weight loss intervention, a variable that has never previously been measured accurately.


Figures

Fig. 1.
Fig. 1.
Adaptations of fuel selection following isocaloric exchange of dietary carbohydrate and fat. A: 24-h respiratory quotient (RQ) in response to switching from a 30 to a 60% fat diet. The simulated changes of RQ (dashed curve) along with the measured values (■) show a progressive approach to the food quotient (FQ; solid curve). B: simulated (dashed curve) and measured (■) 24-h RQ changes in response to a diet switch from 37 to 50% fat corresponding to the depicted changes of FQ (solid curve). Data are presented as means ± SD.
Fig. 2.
Fig. 2.
Metabolic fuel selection and body composition and changes during over- and underfeeding in healthy young men. A, left: 33% overfeeding resulted in the change of simulated and measured body weight (BW; solid curve and ■, respectively) along with increased simulated and measured fat mass (FM; dashed curve and □, respectively). A, right: simulated and measured carbohydrate oxidation rates (dashed curve and ■, respectively) as well as fat oxidation (solid curve and □, respectively) and protein oxidation rates (dotted curve and ▵, respectively). B: BW, FM, and macronutrient oxidation rates in response to 67% underfeeding, where the symbols are identical to A. Data are presented as means ± SD.
Fig. 3.
Fig. 3.
Weight loss and metabolic effects of caloric restriction for 6 mo. A, left: simulated BW change (solid curve) along with the measured values (■) and the simulated FM (dashed curve) and the measured FM (□) changes resulting from a very low-calorie liquid diet followed by a weight maintenance diet. A, right: simulated (dashed curve) and measured (■) total energy expenditure (TEE) in response to the depicted changes of energy intake (EI; solid gray curve). Simulated (solid black curve) and measured resting metabolic rate (RMR; □) along with the simulated physical activity expenditure (PAE; dotted curve). B: a sustained 25% reduction of EI resulted in the simulated and measured changes of BW and FM shown at left and the corresponding TEE, RMR, and PAE changes at right. C: a sustained 12.5% reduction of EI along with a 12.5% increase of PAE resulted in the simulated and measured changes of BW and FM shown at left and the corresponding TEE and RMR changes at right. Data are presented as means ± SD.
Fig. 4.
Fig. 4.
Weight loss and metabolic changes in obese men resulting from diets with differing proportions of carbohydrate and fat. A, top: simulated and measured changes of BW and FM resulting from the 40% fat, 46% carbohydrate diet. A, middle: metabolic responses to this diet, where the symbols are identical to those in Fig. 3. A, bottom: simulated and measured changes of RQ, where the symbols are identical to Fig. 1. B, top: simulated and measured changes of BW and FM resulting from the 20% fat, 66% carbohydrate diet. B, middle: metabolic responses to this diet. B, bottom: simulated and measured changes of RQ. Data are presented as means ± SD.
Fig. 5.
Fig. 5.
Weight loss and weight gain. A, left: simulated and measured changes of BW and FM resulting from a 1,000 kcal/day diet for 8 wk in obese women. A, right: simulated and measured changes of TEE, RMR, and PAE in response to imposed changes of EI, where the symbols are identical to those in Fig. 2. B, left: simulated and measured changes of BW and FM in response to 6 wk of overfeeding by 1,000 kcal/day in healthy young men. B, right: changes of TEE, RMR, and PAE, where the symbols are identical to those in Fig. 3. Data are presented as means ± SD.
Fig. 6.
Fig. 6.
Weight loss and regain dynamics during an outpatient lifestyle intervention. A, left: a typical outpatient weight loss program results in the characteristic BW change trajectory, where the symbols are identical to those in Fig. 3. A, right: predicted free-living EI and TEE underlying the observed BW loss and regain trajectory. B: the model predicted that maintenance of lost BW and FM (left) would have been achieved if the EI over the last 2 yr had been decreased by 170 kcal/day. C: had the initial reduction of EI been sustained for the 3-yr period, the model predicted a progressive decrease of BW and FM shown at left and the corresponding TEE changes shown at right. Data are presented as means ± SD.

References

    1. Aarsland A, Chinkes D, Wolfe RR. Hepatic and whole-body fat synthesis in humans during carbohydrate overfeeding. Am J Clin Nutr 65: 1774–1782, 1997. - PubMed
    1. Acheson KJ, Schutz Y, Bessard T, Anantharaman K, Flatt JP, Jequier E. Glycogen storage capacity and de novo lipogenesis during massive carbohydrate overfeeding in man. Am J Clin Nutr 48: 240–247, 1988. - PubMed
    1. Alpert SS. Growth, thermogenesis, and hyperphagia. Am J Clin Nutr 52: 784–792, 1990. - PubMed
    1. Alpert SS. A limit on the energy transfer rate from the human fat store in hypophagia. J Theor Biol 233: 1–13, 2005. - PubMed
    1. Alpert SS. A two-reservoir energy model of the human body. Am J Clin Nutr 32: 1710–1718, 1979. - PubMed

Publication types