

Ca(2+) puffs originate from preestablished stable clusters of inositol trisphosphate receptors
- PMID: 19934435
- PMCID: PMC2897231
- DOI: 10.1126/scisignal.2000466
Ca(2+) puffs originate from preestablished stable clusters of inositol trisphosphate receptors
Abstract
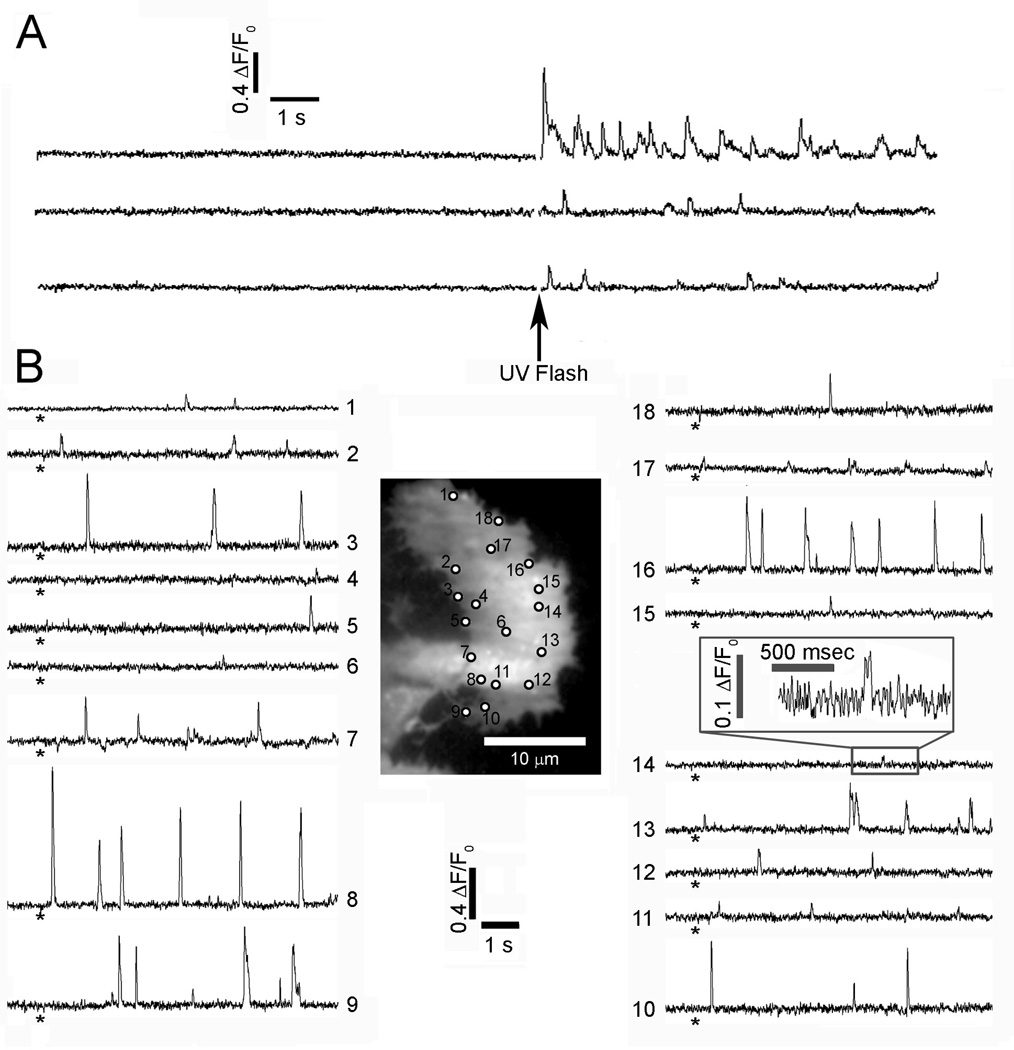
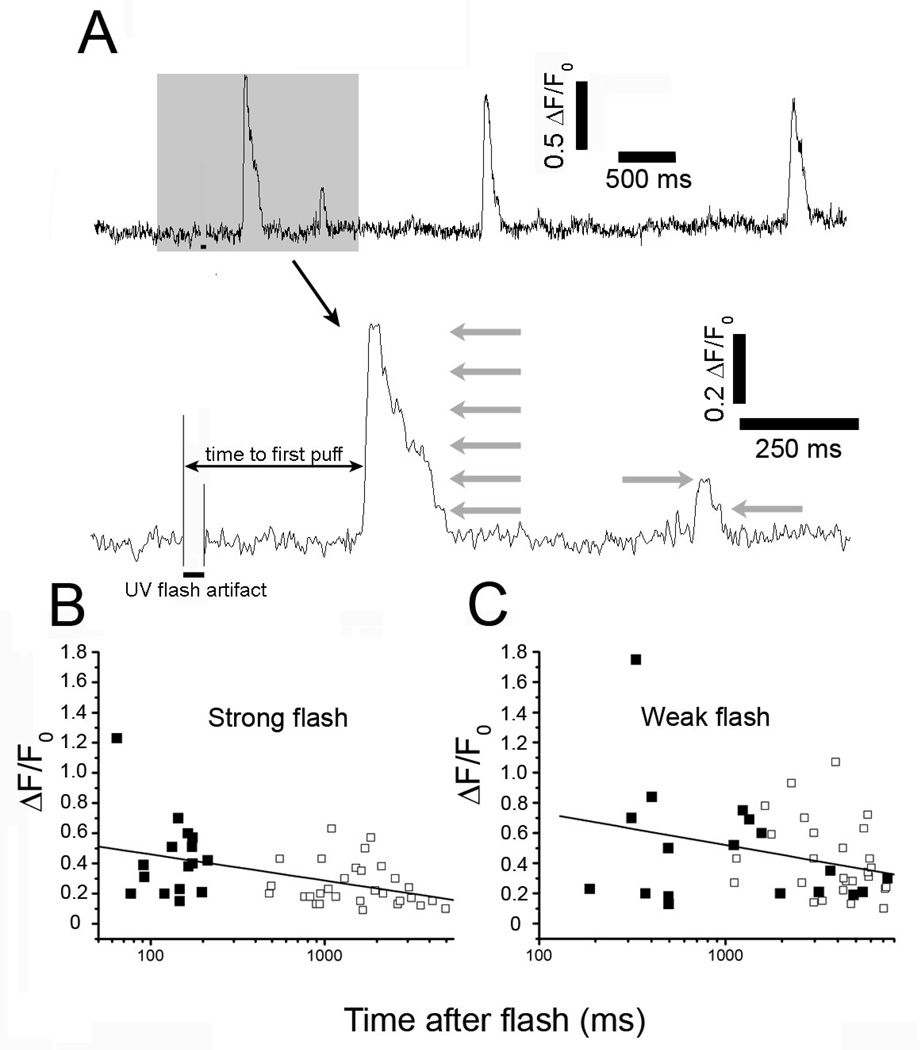
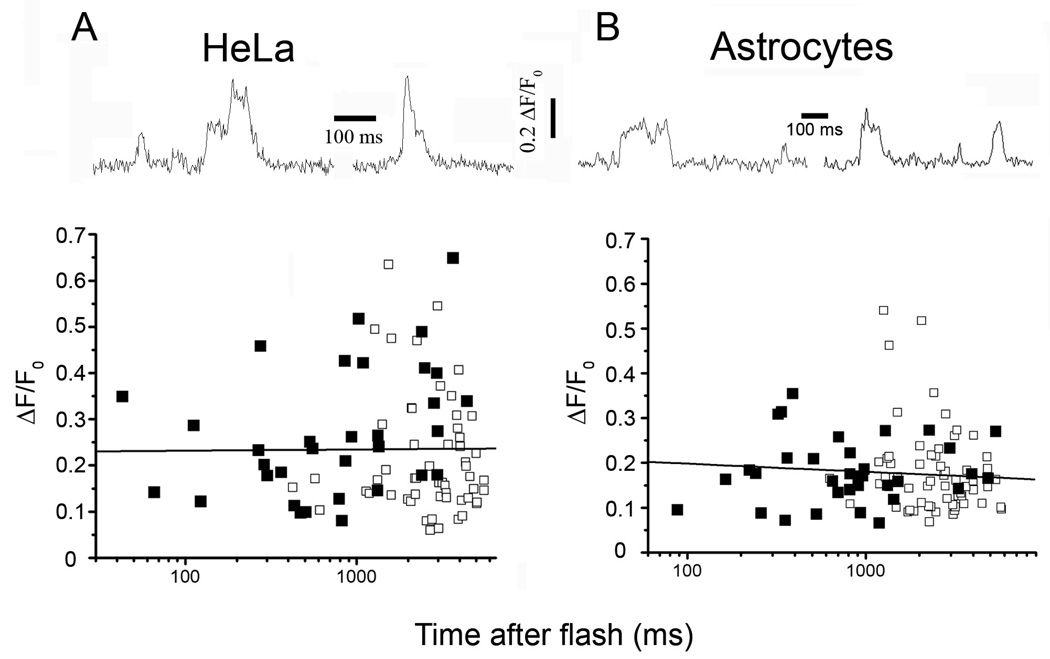
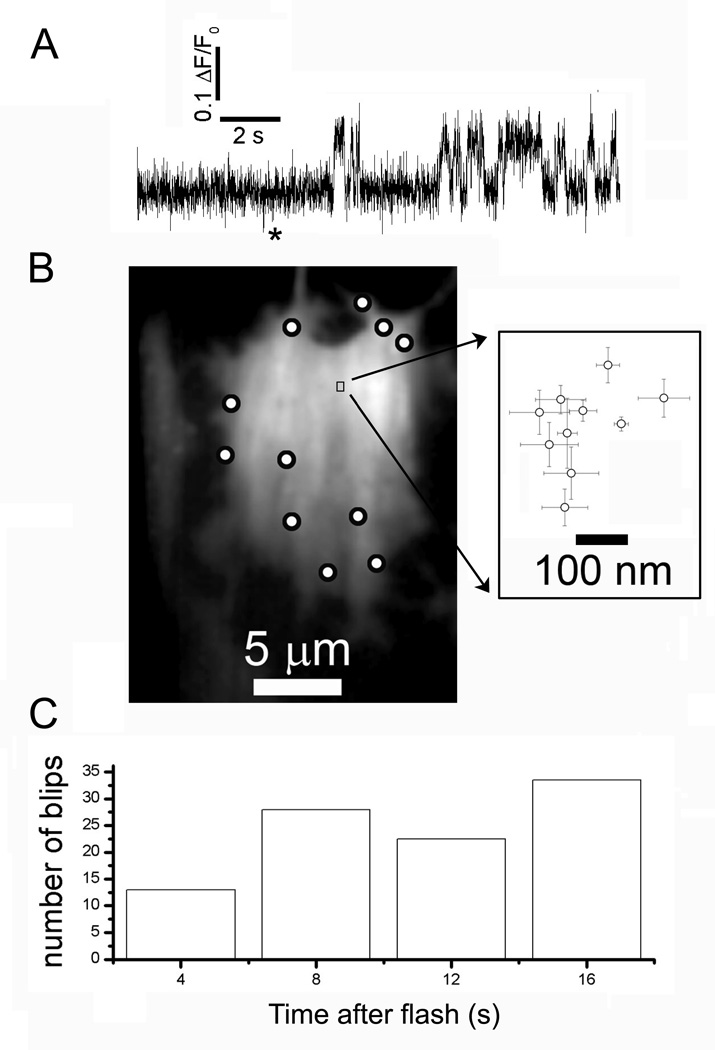
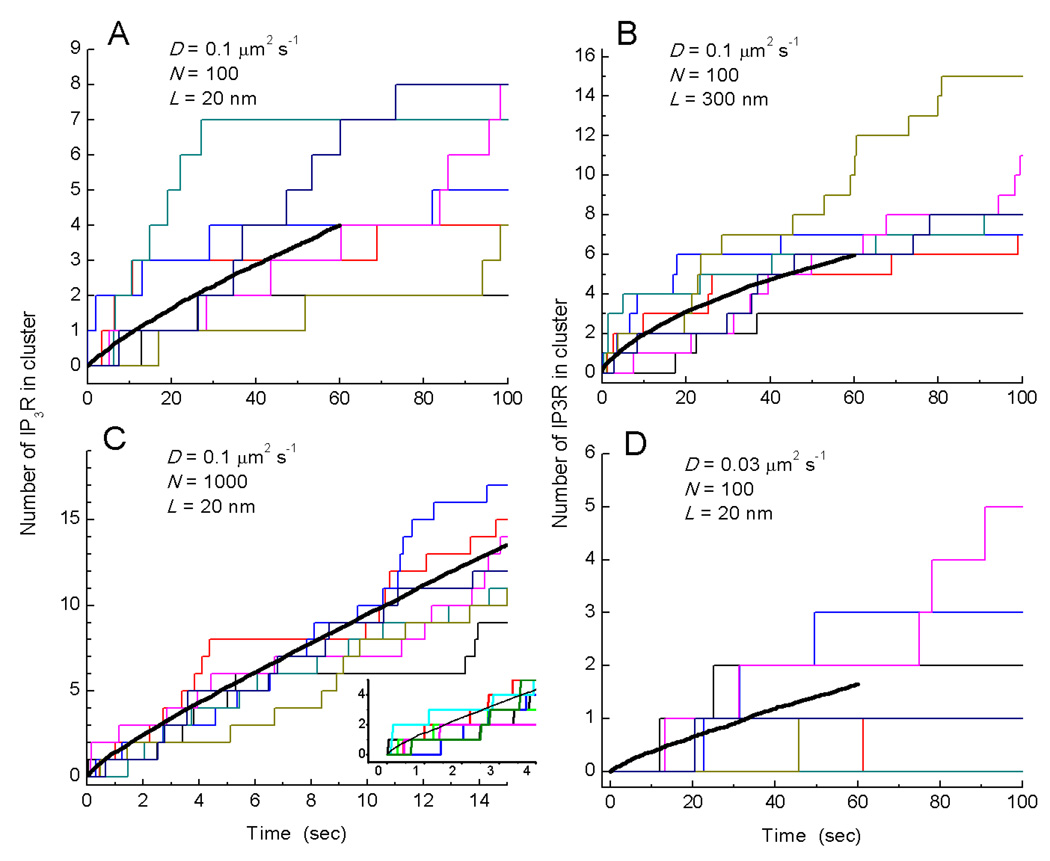
Intracellular calcium ion (Ca(2+)) signaling crucially depends on the clustered organization of inositol trisphosphate receptors (IP(3)Rs) in the endoplasmic reticulum (ER) membrane. These ligand-gated ion channels liberate Ca(2+) to generate local signals known as Ca(2+) puffs. We tested the hypothesis that IP(3) itself elicits rapid clustering of IP(3)Rs by using flash photolysis of caged IP(3) in conjunction with high-resolution Ca(2+) imaging to monitor the activity and localization of individual IP(3)Rs within intact mammalian cells. Our results indicate that Ca(2+) puffs arising with latencies as short as 100 to 200 ms after photorelease of IP(3) already involve at least four IP(3)R channels, and that this number does not subsequently grow. Moreover, single active IP(3)Rs show limited mobility, and stochastic simulations suggest that aggregation of IP(3)Rs at puff sites by a diffusional trapping mechanism would require many seconds. We thus conclude that puff sites represent preestablished, stable clusters of IP(3)Rs and that functional IP(3)Rs are not readily diffusible within the ER membrane.
Figures
Similar articles
-
The probability of triggering calcium puffs is linearly related to the number of inositol trisphosphate receptors in a cluster.Biophys J. 2012 Apr 18;102(8):1826-36. doi: 10.1016/j.bpj.2012.03.029. Biophys J. 2012. PMID: 22768938 Free PMC article.
-
'Trigger' events precede calcium puffs in Xenopus oocytes.Biophys J. 2006 Dec 1;91(11):4024-32. doi: 10.1529/biophysj.106.088872. Epub 2006 Sep 15. Biophys J. 2006. PMID: 16980363 Free PMC article.
-
Inositol (1,4,5)-trisphosphate receptor microarchitecture shapes Ca2+ puff kinetics.Biophys J. 2011 Feb 16;100(4):822-31. doi: 10.1016/j.bpj.2011.01.003. Biophys J. 2011. PMID: 21320425 Free PMC article.
-
Localization and socialization: experimental insights into the functional architecture of IP3 receptors.Chaos. 2009 Sep;19(3):037103. doi: 10.1063/1.3147425. Chaos. 2009. PMID: 19792028 Free PMC article. Review.
-
Intracellular Ca(2+) channels - a growing community.Mol Cell Endocrinol. 2012 Apr 28;353(1-2):21-8. doi: 10.1016/j.mce.2011.08.028. Epub 2011 Aug 25. Mol Cell Endocrinol. 2012. PMID: 21889573 Review.
Cited by
-
Applications of FLIKA, a Python-based image processing and analysis platform, for studying local events of cellular calcium signaling.Biochim Biophys Acta Mol Cell Res. 2019 Jul;1866(7):1171-1179. doi: 10.1016/j.bbamcr.2018.11.012. Epub 2018 Nov 27. Biochim Biophys Acta Mol Cell Res. 2019. PMID: 30500432 Free PMC article.
-
Dynamic Ca2+ imaging with a simplified lattice light-sheet microscope: A sideways view of subcellular Ca2+ puffs.Cell Calcium. 2018 May;71:34-44. doi: 10.1016/j.ceca.2017.11.005. Epub 2017 Dec 1. Cell Calcium. 2018. PMID: 29604962 Free PMC article.
-
A PACAP-activated network for secretion requires coordination of Ca2+ influx and Ca2+ mobilization.Mol Biol Cell. 2024 Jul 1;35(7):ar92. doi: 10.1091/mbc.E24-02-0083. Epub 2024 May 17. Mol Biol Cell. 2024. PMID: 38758660 Free PMC article.
-
Inositol 1,4,5-trisphosphate receptors in the endoplasmic reticulum: A single-channel point of view.Cell Calcium. 2015 Jul;58(1):67-78. doi: 10.1016/j.ceca.2014.12.008. Epub 2014 Dec 18. Cell Calcium. 2015. PMID: 25555684 Free PMC article. Review.
-
Recording single-channel activity of inositol trisphosphate receptors in intact cells with a microscope, not a patch clamp.J Gen Physiol. 2010 Aug;136(2):119-27. doi: 10.1085/jgp.200910390. J Gen Physiol. 2010. PMID: 20660654 Free PMC article.
References
-
- Berridge MJ, Lipp P, Bootman MD. The versatility and universality of calcium signalling. Nat Rev Mol Cell Biol. 2000;1:11. - PubMed
-
- Bezprozvanny I, Watras J, Ehrlich BE. Bell-shaped calcium-response curves of inositol trisphosphate and calcium-gated channels from endoplasmic reticulum of cerebellum. Nature. 1991;351:751. - PubMed
-
- Lipp P, Niggli E. A hierarchical concept of cellular and subcellular calcium signalling. Prog Biophys Mol Biol. 1996;65:265. - PubMed
-
- Parker I, Choi J, Yao Y. Elementary events of I inositol trisphosphate-induced calcium liberation in Xenopus oocytes: hot spots, puffs and blips. Cell Calcium. 1996;20:105. - PubMed
MeSH terms
Substances
Grants and funding
LinkOut - more resources
Full Text Sources
Miscellaneous
