

Diagnosis influences response of cerebral near infrared spectroscopy to intracranial hypertension in children
- PMID: 19935441
- PMCID: PMC3675803
- DOI: 10.1097/PCC.0b013e3181c51cf1
Diagnosis influences response of cerebral near infrared spectroscopy to intracranial hypertension in children
Abstract
Objective: To describe cerebral regional oxygen saturation measured by near infrared spectroscopy in the setting of normal and increased intracranial pressure in children to evaluate the association between cerebral regional oxygen saturation and intracranial pressure in comparison with other clinical variables.
Design: Prospective observational cohort study.
Setting: Two academic tertiary care centers' pediatric intensive care units.
Patients: Thirty patients with intracranial pressure and near infrared spectroscopy monitoring (median age, 11.5 yrs; interquartile range, 5.2-13 yrs) for a range of neurologic diagnoses, including brain tumor, trauma, intracerebral hemorrhage, and hydrocephalus.
Interventions: None.
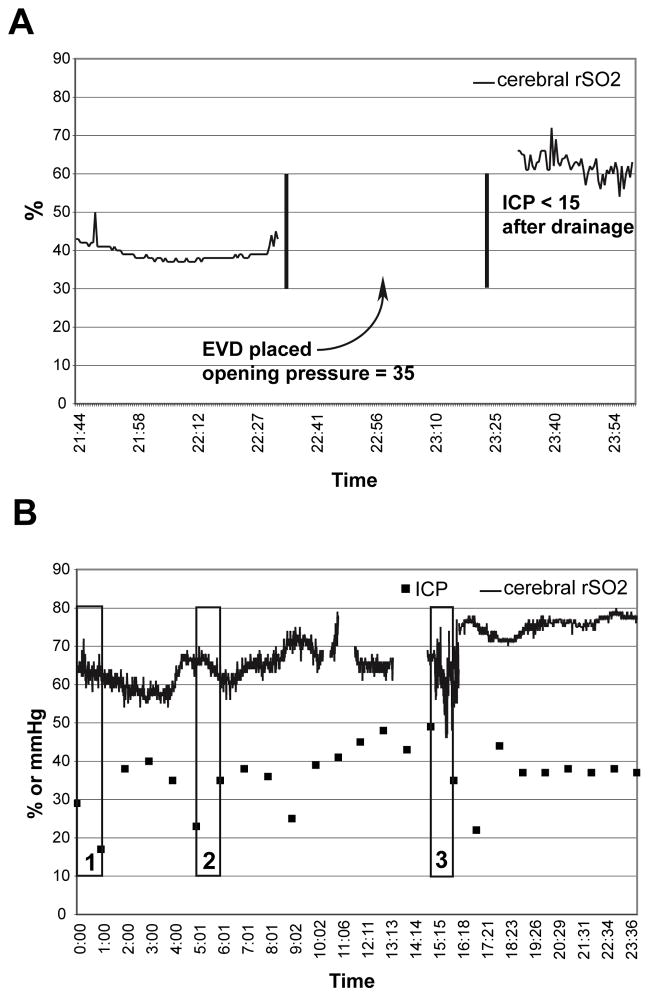
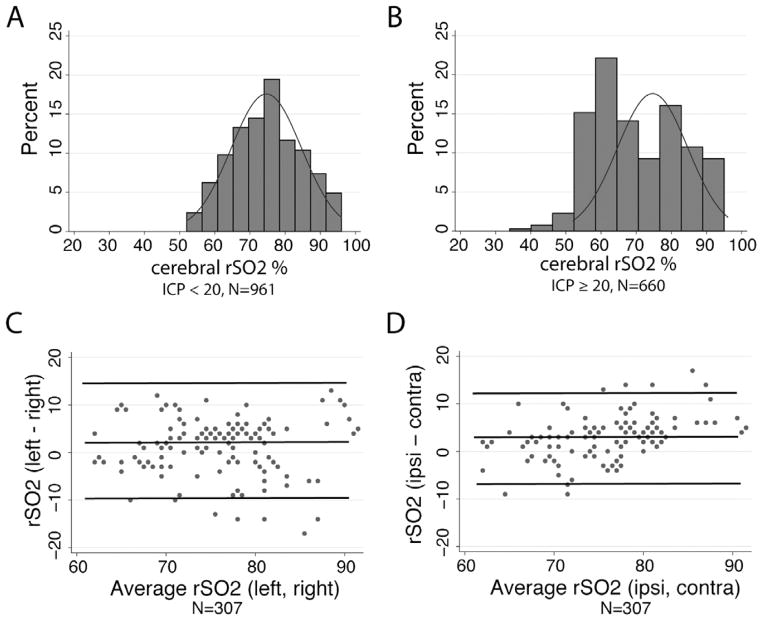
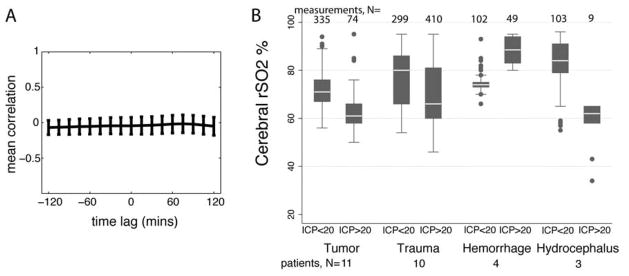
Measurements and main results: Temporally correlated cerebral regional oxygen saturation with hematologic (hematocrit), biochemical (pH), and physiological (intracranial pressure, mean arterial pressure, cerebral perfusion pressure, temperature, heart rate, pulse oximetry and end-tidal carbon dioxide) variables. Cerebral regional oxygen saturation during episodes of increased intracranial pressure was lower than with normal intracranial pressure (mean +/- sd intracranial pressure >20 = 71% +/- 13% vs. intracranial pressure <20 = 75% +/- 10%), although the mean difference (-4%) is small compared with variability in the measurement. Neither isolated values nor change in cerebral regional oxygen saturation were significantly associated with intracranial pressure or cerebral perfusion pressure in the overall population. Isolated values and change in end-tidal CO2 were significantly correlated with cerebral regional oxygen saturation and change in cerebral regional oxygen saturation (all p < 0.01). In exploratory analyses, the diagnostic group significantly modified the effect of intracranial hypertension on regional oxygen saturation: regional oxygen saturation decreased during intracranial hypertension in patients with brain tumors (p = .05) and hydrocephalus (p < .001) but increased during intracranial hypertension in those with intracranial hemorrhage (p < .001).
Conclusions: These data suggest that cerebral regional oxygen saturation is lower with intracranial hypertension. However, the relationship between cerebral regional oxygen saturation and intracranial pressure is strongly influenced by diagnosis.
Figures
Comment in
-
Near infrared reflectance spectroscopy--Farther than we thought?Pediatr Crit Care Med. 2010 Jul;11(4):535-6. doi: 10.1097/PCC.0b013e3181ce02b4. Pediatr Crit Care Med. 2010. PMID: 20606559 No abstract available.
References
-
- Blaha M, Lazar D, Winn RH, Ghatan S. Hemorrhagic complications of intracranial pressure monitors in children. Pediatr Neurosurg. 2003;39(1):27–31. - PubMed
-
- Guyot LL, Dowling C, Diaz FG, Michael DB. Cerebral monitoring devices: analysis of complications. Acta Neurochir Suppl. 1998;71:47–49. - PubMed
-
- Zabramski JM, Whiting D, Darouiche RO, Horner TG, Olson J, Robertson C, Hamilton AJ. Efficacy of antimicrobial-impregnated external ventricular drain catheters: a prospective, randomized, controlled trial. J Neurosurg. 2003;98(4):725–730. - PubMed
-
- Robertson CS, Narayan RK, Gokaslan ZL, Pahwa R, Grossman RG, Caram P, Jr, Allen E. Cerebral arteriovenous oxygen difference as an estimate of cerebral blood flow in comatose patients. J Neurosurg. 1989;70(2):222–230. - PubMed
-
- Madsen PL, Secher NH. Near-infrared oximetry of the brain. Prog Neurobiol. 1999;58 (6):541–560. - PubMed
Publication types
MeSH terms
Substances
Grants and funding
LinkOut - more resources
Full Text Sources
Other Literature Sources
