. 2010 Jan;11(1):83-9.
doi: 10.1038/ni.1826. Epub 2009 Nov 22.

Different routes of bacterial infection induce long-lived TH1 memory cells and short-lived TH17 cells

Affiliations

Different routes of bacterial infection induce long-lived TH1 memory cells and short-lived TH17 cells

Marion Pepper et al. Nat Immunol. 2010 Jan.

Abstract

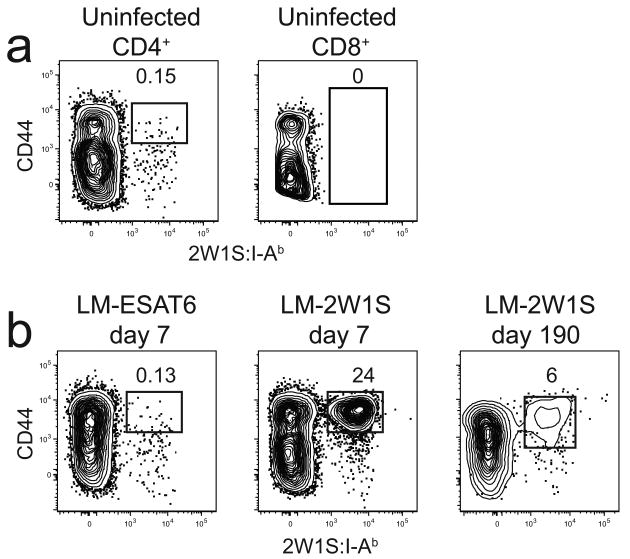
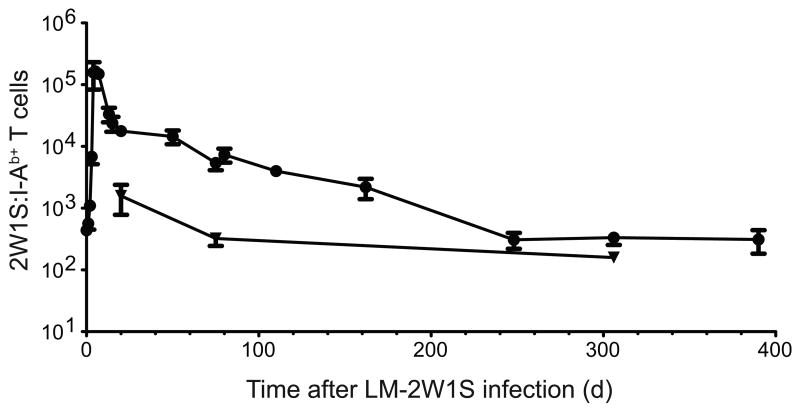
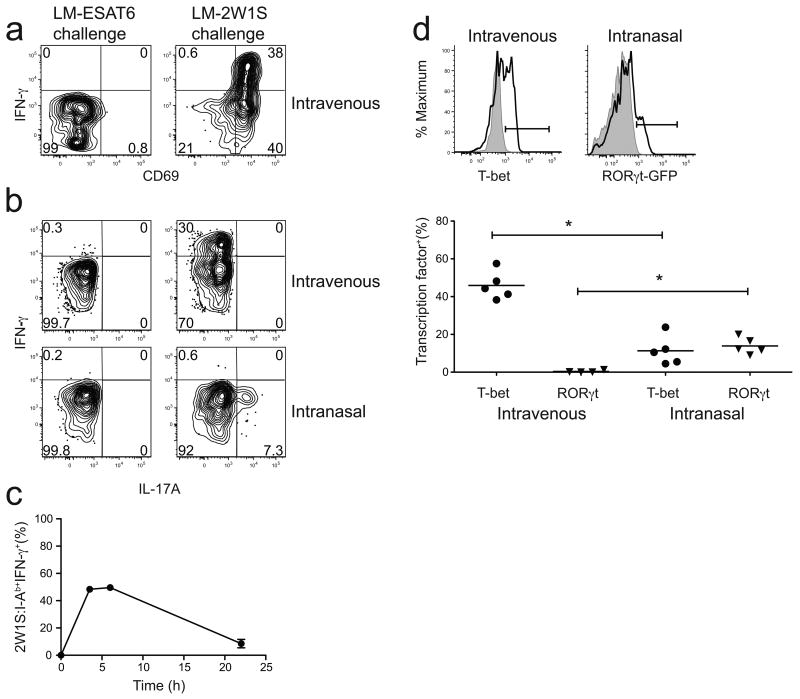
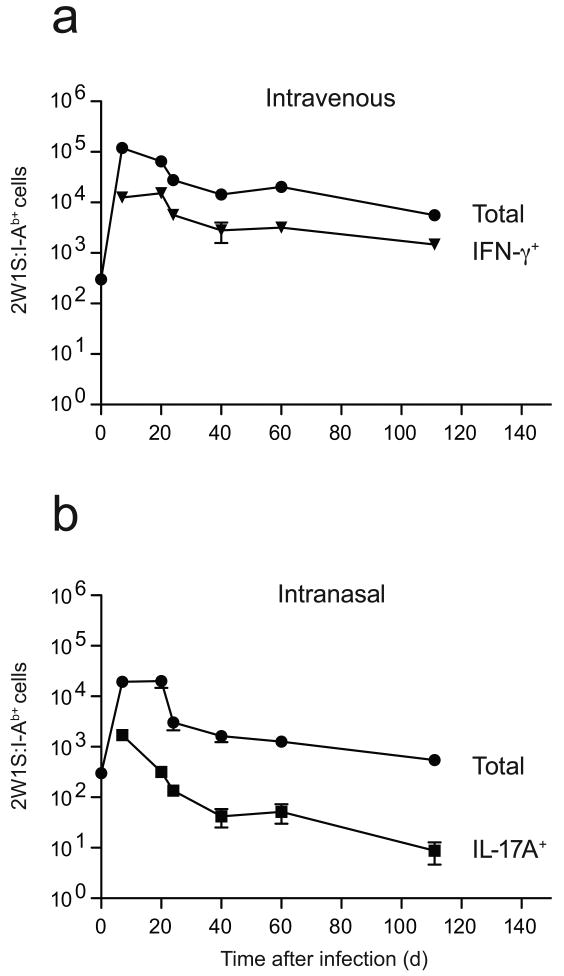
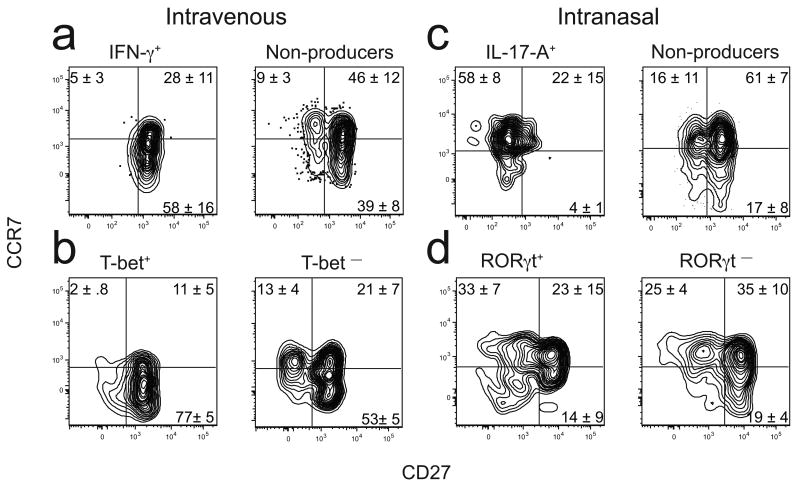
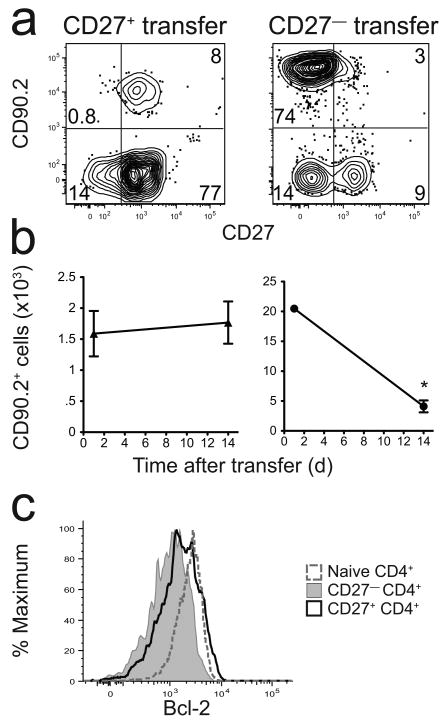
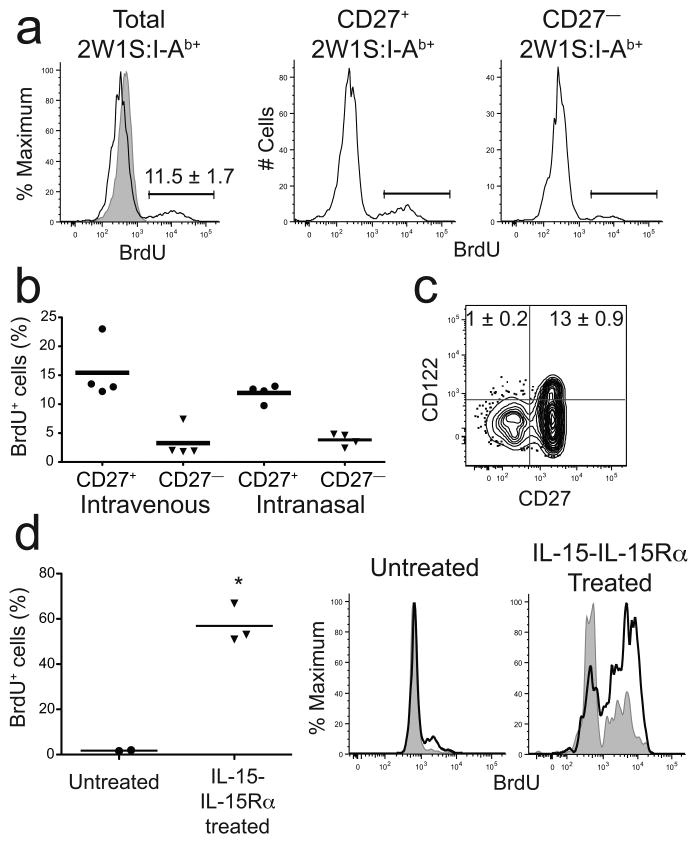
We used a sensitive method based on tetramers of peptide and major histocompatibility complex II (pMHCII) to determine whether CD4(+) memory T cells resemble the T helper type 1 (T(H)1) and interleukin 17 (IL-17)-producing T helper (T(H)17) subsets described in vitro. Intravenous or intranasal infection with Listeria monocytogenes induced pMHCII-specific CD4(+) naive T cells to proliferate and produce effector cells, about 10% of which resembled T(H)1 or T(H)17 cells, respectively. T(H)1 cells were also present among the memory cells that survived 3 months after infection, whereas T(H)17 cells disappeared. The short lifespan of T(H)17 cells was associated with small amounts of the antiapoptotic protein Bcl-2, the IL-15 receptor and the receptor CD27, and little homeostatic proliferation. These results suggest that T(H)1 cells induced by intravenous infection are more efficient at entering the memory pool than are T(H)17 cells induced by intranasal infection.


Figures

Figure 1
Figure 1
Infection with LM-2W1S induces the clonal expansion of 2W1S:I-Ab-specific memory cells. CD4+ or CD8+ T cells were identified in enriched fractions by flow cytometry from CD11c CD11b F4/80 B220 CD3+ gated events. (a) CD4+ T cells (left) or CD8+ T cells (right) from an uninfected B6 mouse with gates on CD44high 2W1S:I-Ab+ (left) or all 2W1S:I-Ab+ cells (right). (b) CD4+ T cells in enriched samples from a B6 mouse 7 days after intravenous infection with LM-ESAT6 (left) or 7 (middle) or 190 (right) days after intravenous LM-2W1S infection. The percentages of cells in the indicated gates are shown. The plots are representative of greater than twenty (a) or 2-5 independent experiments (b).
Figure 2
Figure 2
2W1S:I-Ab-specific CD4+ memory T cells decay after infection with LM-2W1S. Mean number of CD4+ 2W1S:I-Ab+ T cells ± SD (n ≥ 3 for each data point) in the spleen and lymph nodes (circles) or bone marrow (triangles) after intravenous infection with LM-2W1S. A non-linear regression fit of the spleen and lymph node data yielded a T1/2 of 43 days (R2 = 0.94, 95% confidence interval of 30 – 73 days) for points between days 20 and 248.
Figure 3
Figure 3
Lymphokine production by 2W1S:I-Ab-specific CD4+ memory T cells. CD69 expression (a), IFN-γ (a,b), and IL-17A production (b) by 2W1S:I-Ab-specific memory T cells, 2 h after challenge with LM-ESAT6 (left) or LM-2W1S (right). 2W1S:I-Ab-specific memory T cells were induced by intravenous (a,b) or intranasal (b) infection. (c) Percent of 2W1S:I-Ab-specific IFN-γ+ CD4+ memory T cells after stimulation with PMA and ionomycin in the presence of brefeldin A for 3.5 h, 6 h, or 22 h. (d, top) T-bet expression (left) in 2W1S:I-Ab-specific memory T cells (black line) induced by intravenous infection compared to CD44+ CD4+ T-bet deficient cells (gray histogram). eGFP expression in Rorc(γt)+/GFP mice after intranasal infection (right) in 2W1S:I-Ab-specific memory T cells (black line) compared to wild-type 2W1S:I-Ab-specific memory T cells (gray histogram) after intranasal infection. (d, bottom) Scatter plot showing the percentage of T-bet+ or RORγt+ 2W1S:I-Ab-specific memory T cells in individual mice based on the gates in (d, top) (asterisk, P < .01 for T-bet samples, P < 0.05 for RORγt samples). Plots are representative of three (a), six (b), two (c) or four independent experiments examining T-bet and RORγt expression by intracellular staining and one with Rorc(γt)+/GFP mice (d).
Figure 4
Figure 4
Survival of IFN-γ and IL-17A-producing 2W1S:I-Ab-specific CD4+ memory T cells. Mean number (± SD, n = 3–5 at each time point) of total 2W1S:I-Ab-specific CD4+ T cells (circles) induced by intravenous (a) or intranasal (b) infection and 2W1S:I-Ab-specific CD4+ T cells that made IFN-γ but not IL-17A (a, triangles) or IL-17A but not IFN-γ (b, squares) after challenge with LM-2W1S.
Figure 5
Figure 5
Surface phenotype of 2W1S:I-Ab-specific T cells. Representative plot of CCR7 and CD27 expression on 2W1S:I-Ab-specific T cells in mice at least 20 days after intravenous (a,b) or intranasal (c,d) infection.The quadrant lines were based on 2WIS:I-Ab− CD44low naive cells in each sample. This population was uniformly CCR7high and contained CD27low and CD27high subsets. The horizontal line was set at the lowest level of CCR7 on the entire population and the vertical line at the midpoint between the CD27low and CD27high subsets. (a) Cells that produced IFN-γ but not IL-17A (left) or neither (right) after challenge with LM-2W1S. (b) T-bet+ (left) or T-bet (right) antigen-experienced cells without challenge (c) Cells that produced IL-17A but not IFN-γ (left) or neither (right) after challenge with LM-2W1S. (d) RORγt+ (left) or RORγt (right) antigen-experienced cells without challenge. The values on the plots represent the mean percentage of cells (± SD, n ≥ 4) in the indicated quadrants. Data are representative of seven (a), four (b), six (c), or two independent experiments (d).
Figure 6
Figure 6
CD27 CD4+ memory T cells are short-lived. (a) Representative contour plots of CD90.2-enriched fractions of spleen and lymph node cells from mice that received purified CD90.2+ CD27+ (left) or CD27 (right) total CD4+ memory T cells one day earlier. (b) Mean number (± SD, n = 3-4) of CD90.2+ CD27+ (left) or CD27 (right) cells recovered 1 or 14 days after transfer into B6.PL-Thy1a recipients. The number of CD27 cells recovered on day 14 was significantly lower than the number recovered on day 1, P = 0.0005 (asterisk). (c) Bcl-2 expression by total naïve CD4+ T cells (dashed line), or CD27 (gray histogram) or CD27+ (black line) 2W1S:I-Ab+ memory T cells. Data are representative of three (a,b) or two independent experiments (c).
Figure 7
Figure 7
CD4+ memory T cells undergo limited homeostatic proliferation. (a) Representative BrdU histograms for total (left), CD27+ (middle), or CD27 (right) 2W1S:I-Ab+ CD4+ memory cells in mice fed BrdU for 14 days beginning 40 days after intravenous LM-2W1S infection, along with a histogram of total CD4+ T cells (gray) from a mouse that did not receive BrdU (left). Gates used to identify BrdU+ cells are shown. (b) Scatterplot of the percentage of BrdU+ 2W1S:I-Ab+ CD4+ memory T cells that were CD27+ or CD27 in individual mice, based on the gates shown in (a). (c) Representative contour plot of CD122 and CD27 on 2W1S:I-Ab+ CD4+ memory T cells induced by intravenous infection. Mean percentages (± SD, n = 5) of CD122+ cells are shown in the relevant quadrants. (d) Scatterplot of the percent BrdU+ 2W1S:I-Ab+ CD4+ memory cells in individual mice that were not injected (circles) or injected with IL-15–IL-15Rα complexes (triangles) and given BrdU for 5 days beginning 20 days after intravenous LM-2W1S infection. BrdU+ cells were identified as shown in (a). Representative histograms of BrdU incorporation by CD27+ (solid line) or CD27 (gray) 2W1S:I-Ab+ CD4+ memory T cells in mice that were not injected (left) or injected with IL-15–IL-15Rα complexes (right) and given BrdU for 5 days beginning 20 d after intravenous LM-2W1S infection. Horizontal bars on each scatter plot indicate the means for each population. The number of BrdU+ cells in the IL-15–IL-15Rα complex-treated group was significantly greater than in the untreated group (asterisk, P = 0.003). Data are representative of three (a,b), two (c), one experiment (d).

Comment in

References

    1. Jenkins MK, et al. In vivo activation of antigen-specific CD4 T cells. Annu Rev Immunol. 2001;19:23–45. - PubMed
    1. Ahmed R, Gray D. Immunological memory and protective immunity: understanding their relation. Science. 1996;272:54–60. - PubMed
    1. Sallusto F, Lenig D, Forster R, Lipp M, Lanzavecchia A. Two subsets of memory T lymphocytes with distinct homing potentials and effector functions. Nature. 1999;401:708–712. - PubMed
    1. Masopust D, Vezys V, Marzo AL, Lefrancois L. Preferential localization of effector memory cells in nonlymphoid tissue. Science. 2001;291:2413–2417. - PubMed
    1. Reinhardt RL, Khoruts A, Merica R, Zell T, Jenkins MK. Visualizing the generation of memory CD4 T cells in the whole body. Nature. 2001;410:101–105. - PubMed

Publication types

MeSH terms

Substances