

Automatic policing of biochemical annotations using genomic correlations
- PMID: 19935659
- PMCID: PMC2935526
- DOI: 10.1038/nchembio.266
Automatic policing of biochemical annotations using genomic correlations
Abstract
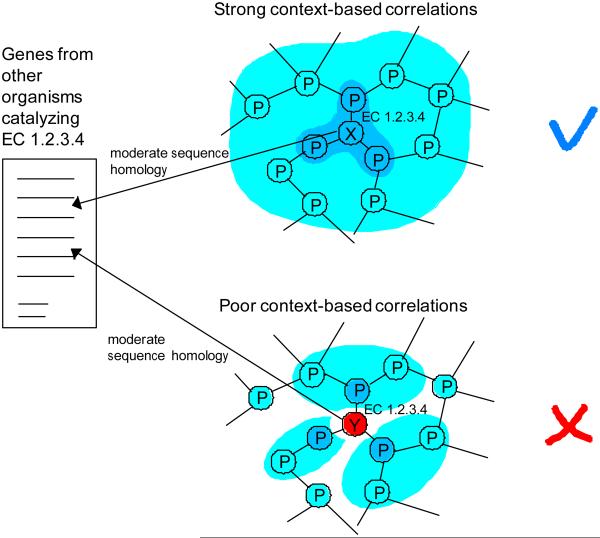
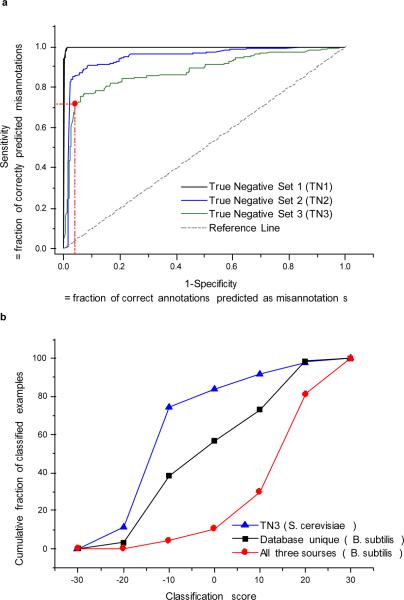
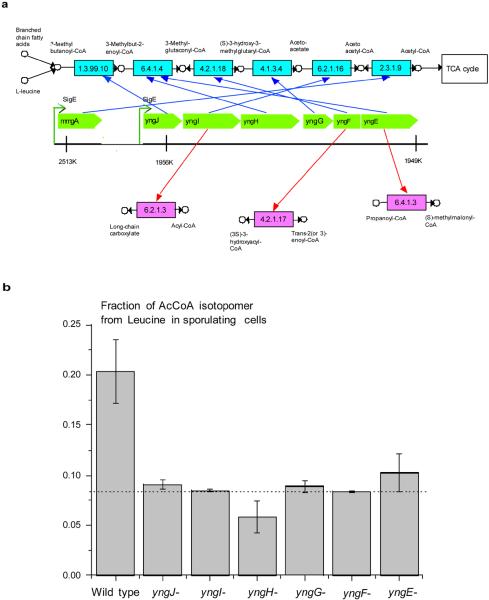
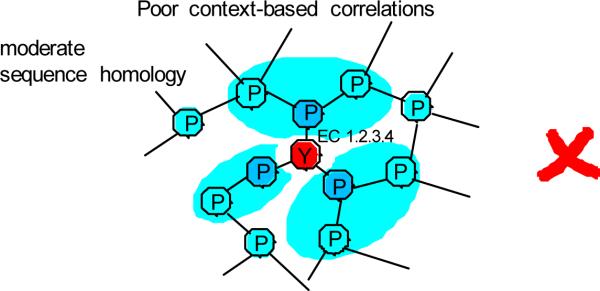
With the increasing role of computational tools in the analysis of sequenced genomes, there is an urgent need to maintain high accuracy of functional annotations. Misannotations can be easily generated and propagated through databases by functional transfer based on sequence homology. We developed and optimized an automatic policing method to detect biochemical misannotations using context genomic correlations. The method works by finding genes with unusually weak genomic correlations in their assigned network positions. We demonstrate the accuracy of the method using a cross-validated approach. In addition, we show that the method identifies a significant number of potential misannotations in Bacillus subtilis, including metabolic assignments already shown to be incorrect experimentally. The experimental analysis of the mispredicted genes forming the leucine degradation pathway in B. subtilis demonstrates that computational policing tools can generate important biological hypotheses.
Figures
References
-
- Andrade MA, et al. Automated genome sequence analysis and annotation. Bioinformatics. 1999;15:391–412. - PubMed
-
- Rost B. Enzyme function less conserved than anticipated. J. Mol. Biol. 2002;318:595–608. - PubMed
-
- Tian W, Skolnick J. How well is enzyme function conserved as a function of pairwise sequence identity? J. Mol. Biol. 2003;333:863–882. - PubMed
-
- Brenner SE. Errors in genome annotation. Trends Genet. 1999;15:132–133. - PubMed
-
- Gilks WR, Audit B, De Angelis D, Tsoka S, Ouzounis CA. Modeling the percolation of annotation errors in a database of protein sequences. Bioinformatics. 2002;18:1641–1649. - PubMed
MeSH terms
Substances
Associated data
- PubChem-Substance/85267074
- PubChem-Substance/85267075
- PubChem-Substance/85267076
- PubChem-Substance/85267077
- PubChem-Substance/85267078
- PubChem-Substance/85267079
- PubChem-Substance/85267080
- PubChem-Substance/85267081
- PubChem-Substance/85267082
- PubChem-Substance/85267083
- PubChem-Substance/85267084
- PubChem-Substance/85267085
- PubChem-Substance/85267086
- PubChem-Substance/85267087
- PubChem-Substance/85267088
- PubChem-Substance/85267089
- PubChem-Substance/85267090
- PubChem-Substance/85267091
- PubChem-Substance/85267092
- PubChem-Substance/85267093
- PubChem-Substance/85267094
- PubChem-Substance/85267095
- PubChem-Substance/85267096
- PubChem-Substance/85267097
- PubChem-Substance/85267098
- PubChem-Substance/85267099
- PubChem-Substance/85267100
- PubChem-Substance/85267101
- PubChem-Substance/85267102
- PubChem-Substance/85267103
Grants and funding
LinkOut - more resources
Full Text Sources
Molecular Biology Databases
