. 2009 Dec 1;101(11):1900-8.
doi: 10.1038/sj.bjc.6605419.

Cellular senescence induced by aberrant MAD2 levels impacts on paclitaxel responsiveness in vitro

Affiliations

Cellular senescence induced by aberrant MAD2 levels impacts on paclitaxel responsiveness in vitro

M Prencipe et al. Br J Cancer. .

Erratum in

  • Br J Cancer. 2010 Jan 19;102(2):456. Mosetto, M [corrected to Tosetto, M]

Abstract

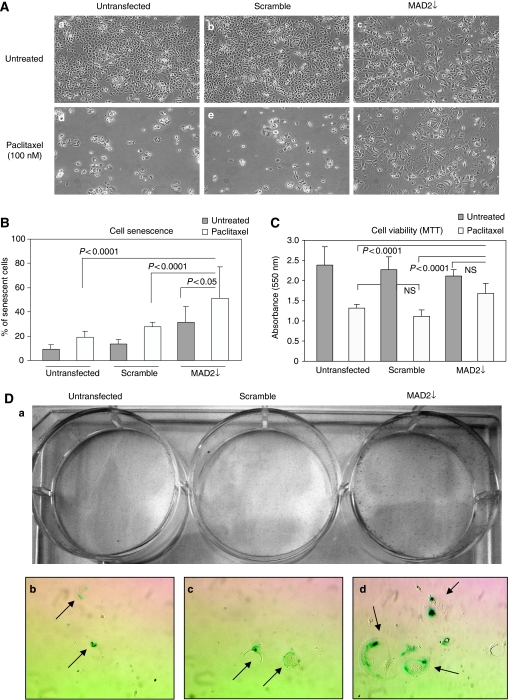
Background: The mitotic arrest deficiency protein 2 (MAD2) is a key component of the mitotic spindle assembly checkpoint, monitoring accurate chromosomal alignment at the metaphase plate before mitosis. MAD2 also has a function in cellular senescence and in a cell's response to microtubule inhibitory (MI) chemotherapy exemplified by paclitaxel.

Methods: Using an siRNA approach, the impact of MAD2 down-regulation on cellular senescence and paclitaxel responsiveness was investigated. The endpoints of senescence, cell viability, migration, cytokine expression, cell cycle analysis and anaphase bridge scoring were carried out using standard approaches.

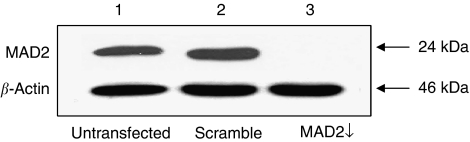
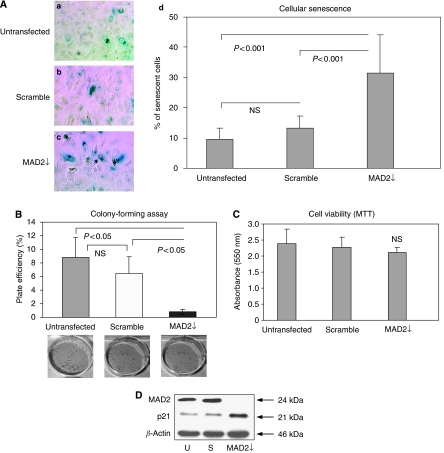
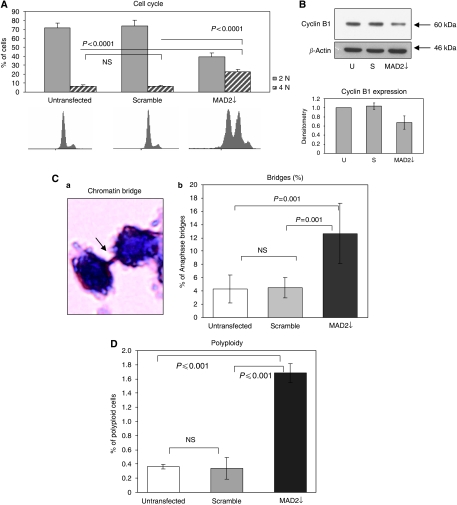
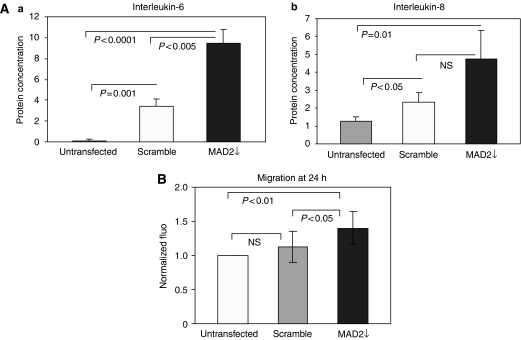
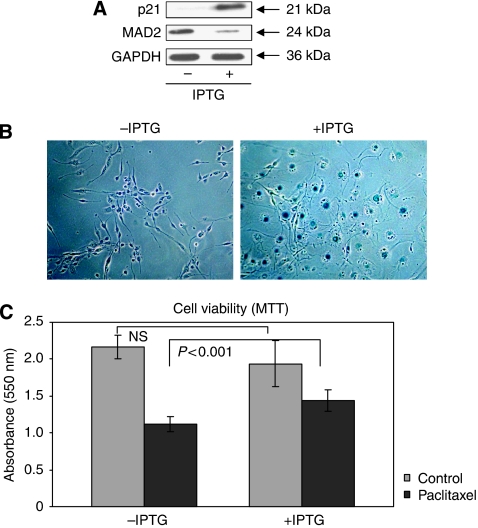
Results: We show that MAD2 down-regulation induces premature senescence in the MCF7 breast epithelial cancer cell line. These MAD2-depleted (MAD2) cells are also significantly replicative incompetent but retain viability. Moreover, they show significantly higher levels of anaphase bridges and polyploidy compared to controls. In addition, these cells secrete higher levels of IL-6 and IL-8 representing key components of the senescence-associated secretory phenotype (SASP) with the ability to impact on neighbouring cells. In support of this, MAD2 cells show enhanced migratory ability. At 72 h after paclitaxel, MAD2 cells show a significant further induction of senescence compared with paclitaxel naive controls. In addition, there are significantly more viable cells in the MAD2 MCF7 cell line after paclitaxel reflecting the observed increase in senescence.

Conclusion: Considering that paclitaxel targets actively dividing cells, these senescent cells will evade cytotoxic kill. In conclusion, compromised MAD2 levels induce a population of senescent cells resistant to paclitaxel.


Figures

Figure 1
Figure 1
siRNA MAD2 protein down-regulation in MCF-7 breast cancer cells. Western blot analysis demonstrates a robust reduction of the MAD2 protein in the MAD2↓ cells (lane 3) compared with the untransfected (lane 1) and scramble (lane 2) controls. β-actin was used as a loading control.
Figure 2
Figure 2
MAD2 down-regulation induces cellular senescence in MCF-7 breast cancer cells. (A) 15 × 104 cells were seeded in each well of a six-well plate. They were either left untransfected or transfected with either MAD2 siRNA or scramble siRNA. Post siRNA reduction of MAD2, morphological changes were evident with MAD2-depleted (MAD2↓) cells appearing flattened and enlarged and more vacuole-rich, compared with the untransfected and scramble controls. SA-β-galactosidase staining (panels a–c) shows a significantly higher percentage of senescent cells in the MAD2↓ cells compared with the untransfected and scramble controls (P<0.001) (panel d). (B) Plate efficiency percentage (number of colonies formed/number of cells seeded) × 100%, in MAD2↓ cells compared with the untransfected and scramble controls. The colony count showed a significant lower number of colonies in MAD2↓ cells, compared with the controls (P<0.05). (C) The MTT assay showed the same viability for untransfected, scramble and MAD2↓ cells (P>0.05). (D) Western blotting analysis showed up-regulation of the p21 senescent marker following siRNA down-regulation of MAD2 compared with the untransfected and the scramble controls. β-actin was used as a loading control.
Figure 3
Figure 3
MAD2 down-regulation alters cell cycle kinetics inducing anaphase bridge formation. (A) Following MAD2 siRNA down-regulation, the cell cycle appeared highly de-regulated, showing less cells with 2N DNA content (P<0.0001) and more in 4N (P<0.0001). (B) Western blotting analysis of cyclin B1 shows a significant decrease of this protein in the MAD2↓ cells compared with the untransfected and scramble controls. (C) Anaphase bridges were visualised using haematoxylin staining, which is a nuclear staining able to highlight only the nuclear content (panel a). MAD2↓ cells demonstrate a three-fold higher percentage of anaphase bridges compared with the untransfected and scrambled controls (P⩽0.001) (panel b). (D) MAD2 down-regulation also results in a higher percentage of polyploid cells (>4N) than the control lines (P⩽0.001). Flow cytometry data were analysed by Summit 4.2 software. Mean values were compared using the t-test assuming equal variances.
Figure 4
Figure 4
MAD2 down-regulation alters the protein secretion of cells and enhances cell migration. (A) (Panel a) ELISA analysis shows a three-fold increase in IL-6 levels in the MAD2↓ cells compared with the scramble (P<0.005) and the untransfected (P<0.001) controls. (Panel b) MAD2↓ cells show a higher expression of IL-8 compared with the controls. However, this increase reaches statistical significance only in comparison with the untransfected control (P=0.01). (B) MAD2↓ cells show a higher migration ability compared with the untransfected (P<0.01) and scramble (P<0.05) controls. Mean values were compared using the t-test assuming equal variances.
Figure 5
Figure 5
MAD2 down-regulation induces paclitaxel resistance through cellular senescence induction in MCF7 cells. (A) 15 × 104 cells were seeded in each well of a six-well plate. They were either left untransfected or transfected with either MAD2 siRNA or scramble siRNA. Twenty-four hours following transfection, they were either treated with 100 nM of paclitaxel or left untreated. Phase contrast images captured 72 h post paclitaxel treatment showed that MAD2↓ cells remained attached to the flask with many displaying typical senescence morphology (panel f), contrasting dramatically with the untransfected and scramble controls (Panels d and e), which display a rounded shape eventually detaching from the flask. (B) The SA-β-galactosidase staining post paclitaxel treatment shows an increase in cellular senescence in the MAD2↓ cells compared with the untransfected and scramble controls (P<0.0001). Moreover, a significantly higher percentage of senescent cells in the MAD2↓-depleted cells was observed (P<0.05) compared with the MAD2↓ untreated cells. (C) The MTT assay shows a significantly higher (P<0.0001) percentage of viability in the MAD2↓ cells post paclitaxel treatment compared with the untransfected and scramble controls. (D) Post transfection and 100 nM paclitaxel treatment for 72 h, cells were trypsinized and 10 000 cells were seeded in each well and cultured for 10 days. (Panel a) Crystal violet staining showed significantly more viable cells in the MAD2↓ well compared with the untransfected and scramble controls. (Panels b–d) Phase contrast pictures at 10 × magnification show more senescence cells (arrows) in the MAD2↓ well compared with the untransfected and scramble controls.
Figure 6
Figure 6
p21 induction of cellular senescence induces paclitaxel resistance in HT1080 p21-9 human fibrosarcoma cells. (A) Western blot analysis shows down-regulation of the MAD2 protein following up-regulation of p21, induced by IPTG. GAPDH was used as a loading control. (B) β-galactosidase staining shows an increase in senescent cells following IPTG induction of p21 and concomitant MAD2 down-regulation. (C) The MTT cell viability assay shows the same viability in the HT1080 p21-9 cells before paclitaxel treatment, regardless of p21 induction by IPTG. However, a significant higher viability is displayed by the IPTG-treated cells when compared with the IPTG non-treated cells, after paclitaxel (P<0.001).

Similar articles

Cited by

References

    1. Beauséjour CM, Krtolica A, Galomi F, Narita M, Lowe SW, Yaswen P, Campisi J (2003) Reversal of human cellular senescence: role of the p53 and p16 pathway. EMBO J 16: 4212–4222 - PMC - PubMed
    1. Bodnar AG, Ouellette M, Frolkis M, Holt SE, Chiu CP, Morin GB, Harley CB, Shay JW, Lichtsteiner S, Wright WE (1998) Extension of life span by introduction of telomerase into normal human cells. Science 279: 349–352 - PubMed
    1. Chang BD, Xuan Y, Broude EV, Zhu H, Schott B, Fang J, Roninson IB (1999) Role of p53 and p21waf1/cip1 in senescence-like terminal proliferation arrest induced in human tumor cells by chemotherapeutic drugs. Oncogene 18(34): 4808–4818 - PubMed
    1. Chang BD, Watanabe K, Broude EV, Fang J, Poole JC, Kalinichenko TV, Roninson IB (2000) Effects of p21Waf1/Cip1/Sdi1 on cellular gene expression: implications forcarcinogenesis, senescence, and age-related diseases. PNAS USA 97(8): 4291–4296 - PMC - PubMed
    1. Chang BD, Swift ME, Shen M, Fang J, Broude EV, Roninson IB (2002) Molecular determinants of terminal growth arrest induced in tumor cells by a chemotherapeutic agent. PNAS 99: 389–394 - PMC - PubMed

Publication types

MeSH terms